I typed in the weekly deaths in major US-cities Feb-May 1918, , the supposed 1st wave of the 1918 pandemic. NY,Bridgeport, CT were early, as in the 2nd wave, suggesting that it came by ship (from where ??) Boston , New England is unclear, did they have it even earlier or not at all ?
-
Re: 1918 Analysis with Charts and Graphs
see, how the deaths-age-structure normalized after 1918
ratio for England 1918 by age1groups:
-------------------------------------------------------------
[picture 1918ag5.gif was replaced , now also showing 1957 and 1968]Attached FilesLeave a comment:
-
-
Re: 1918 Analysis with Charts and Graphs
all the old public heath reports are now available at pubmed,
weekly since 1896
SALVADOR.
Influenza.
Epidemic influenza was reported, September 27, 1918, to be preva-
lent in the Republic of Salvador.
In the city of Sani Salv-ador about
20,000 cases were stated to have OcCUiTed.
Infuenza was reported present at MArlm,( Swedlen, (huring the first
two weeks in September, 1918, with .521 eases.
Influenza was reported epi(lemic at Barevlona, -Spain, October 9,
1918, with 5,000casesand many fatalities.
During the monitlh of September, 1918, 482 cases of in-ifluenza, with
433 deaths, were reported at Brest, France. On October 18, 1918, the
epidemic was stated to be iniereasinig.
The steamship Makai M.aru from San Francisco, Cal., arrived at
Honolulu, Hawaii, with a history of 27 cases of influenza occurring
among the crew from October 7, 1918, to the date of the arrival of
the vessel at Honolulu.
Sep.13
Epidemic influenza has been reported in several countries in Europe
during the summer-of 1918, more especially in Spain.
According to press dispatches, 8,000,000 persons have suffered from the disease in
that country.
Most of the cases reported to the Public Health.Service have been
from France, England, Norway, and Switzerland, although a mildform
has been reported in Canton, China.
It has appeared at Prince Edward Island, Canada, and in the Island of Guadeloupe in the West
Indies, probably an extension from European ports.
On September 12, 1918, a sudden outbreak of influenza was re-
portedatNew London, Conn., andvicinity, about 60case
having
been1 notified.
On September 12, 1918,
a sudden outbreak of influenza was re-
ported in Boston, Mass., and vicinity, where more than 1,400 cases
of the disease have been notified since the begnning of the outbreak
about August 28, 1918.
Many of the cases are of severe type, and
pneumonia has developed in about 10 per cent of the case.
About
25 or 30 deaths have resulted.
4pidemicinfluenza was reported present., August 3, 1918, at
BAsse Terre, Guadeloupe.
Epidemic influenza, with ?n estimated number of about 1,500
cases, was reported present '*
Christiania, Norway, July 13, 1918.
The outbreak of the epidemic occumed about June 15,, 191
The
character of the disease was stated to, remble that ofgiip
Epidemic influenza was reported still present at Birmingham,
England, during the week ended July 6, 1918, with 96 deaths attrib-
uted to the disease.
An outbreak of influenza, with many fatal cases, was reported at
Bern,Switzerland, July 30, 1918.
Fevers of an undetermined nature were reported during April and
May at various points from Norfolk to Louisiana.
An examination
of the records and reports of the physicians who have treated these
cases leads to the belief that these fevers were mainly influenza of
mild type.
-----------------------------------------------
Massachusetts death statistics is available in annually pdfs since 1840Leave a comment:
-
Re: 1918 Analysis with Charts and Graphs
the 1918 USA mortality statistical pdf file at
has 74 MB and 593 pages, so it takes some minutes to download.
It resides on my HD under the name 1918st.pdf, together with the files
from 1905st.pdf to 1959st.pdf for the other years.
Since 1959 we have all the anonymized death certificates available
online , see the mortality thread (link), although since 2004 the
geographical data is removed from them.
The tables from 1918st are not available in computer-readable form,
it would be useful to have them. OCR doesn't work so well and produces
many errors on that text.
You have to wonder how they typed in all the numbers in those
early years without computers !
~ million numbers, several million digits, ~500 hours for a human.
Here are the tables-descriptions from 1918st:
----------------------------
age related:
(page=page in pdf,pages long,entries,TABLE-number,description)
144=138,026,035728,TABLE 3. --color2,area6+state30+cities580,agegroup29
170=164,036,027144,TABLE 4. --race13,area6+states30,sex2,age29
258=251,046,014500,TABLE 7x. --color3,cause189(250),sex2,age29
294=287,138,783000,TABLE 8. --color3,cause189(250),area6+states30,age29
432=425,051,114912,TABLE 9. --cause38,cities56,(color3),age18
----------------------------------
monthly data:
123=118,010,007969,TABLE 1. --month13,area3+state30+cities580
483=476,038,071760,TABLE 10. --area6+states30+cities56,(color3),cause20,month13
--------------------------------------
with cause of death:
114=111,004,002268,TABLE II. --#+rate2,years6,cause189
236=230,022,012474,TABLE 6. -- area3+states30+,rural2,cause189
258=251,022,014500,TABLE 7. --all1,cause189(250),sex2,age29
270=263,012,014500,TABLE 7A. --white1,cause189(250),sex2,age29
282=275,012,014500,TABLE 7B. --colored1,cause189(250),sex2,age29
294=287,138,783000,TABLE 8. --cause189(250),color3,area6+states30,age29
118=115,005,001178,TABLE III.--states31,cause rate38
206=200,030,046816,TABLE 5. --area6+states30+cities580,color2,cause38
432=425,051,114912,TABLE 9. --cause38,cities56,(color3),age18
483=476,038,071760,TABLE 10. --area6+states30+cities56,(color3),cause20,month13
521=514,052,111780,TABLE 11. --<1,area6+states30+cities56,(col),cause27,age15
-------------------------------------------------
short descriptions:
1918 Deaths (exclusive of Stillbirths) in the registration area
(exclusive of Hawaii),
094=091,002,000333,TABLE IA. --race3,rural3,states37
096=093,018,010000,TABLE IB. --regions cities2500,residence status4
114=111,004,002268,TABLE II. --#+rate2,years6,cause189
118=115,005,001178,TABLE III.--states31,cause rate38
123=118,010,007969,TABLE 1. --month13,area3+state30+cities580
133=128,011,008624,TABLE 2. --area6+states30+cities580,race4+nativity10
144=138,026,035728,TABLE 3. --color2,area6+state30+cities580,agegroup29
170=164,036,027144,TABLE 4. --area6+states30,sex2,race13,agegroup29
206=200,030,046816,TABLE 5. --area6+states30+cities580,color2,cause38
236=230,022,012474,TABLE 6. -- area3+states30+,rural2,cause189
258=251,022,014500,TABLE 7. --all1,cause189(250),sex2,age29
270=263,012,014500,TABLE 7A. --white1,cause189(250),sex2,age29
282=275,012,014500,TABLE 7B. --colored1,cause189(250),sex2,age29
294=287,138,783000,TABLE 8. --cause189(250),color3,area6+states30,age29
432=425,051,114912,TABLE 9. --cause38,cities56,(color3),age18
483=476,038,071760,TABLE 10. --area6+states30+cities56,(color3),cause20,month13
521=514,052,111780,TABLE 11. --<1,area6+states30+cities56,(col),cause27,age15
MAPS.
008,Growth of the registration area for deaths: 1880 to 1918
DIAGRAMS.
010,Percentages which the population and land area of the registration
area formed of the total population and land area of the United States
for the years 1880, 1890, and 1900 to 1918
010,Per cent of deaths in the registration area (exclusive of Hawaii)
by color, by nativity of white persons, and by parent nativity of the
native white: 1918
012,Number of deaths in the registration area (exclusive of Hawaii)
at all ages, under 1 year of age, and from 1 to 4 years of age,
for each of the years 1900 to 1918
012,Per cent of deaths in the registration area (exclusive of Hawaii)
under 1 year of age, from 1 to 4 years, and 5 years - and over,
for each of the years 1900 to 1918
016, General death rates of the United States (registration area)
and certain foreign countries for each of the years from 1900 to 1917
022,Death rates from certain important causes of death in the registration
area of the United States for each of the years from 1900 to 1918
SUPPLEMENT.
574,HAWAII
589,SOLDIERS, SAILORS, AND MARINES
594,ADDITIONAL DEATHS
--------------------------complete text of content--------------
DEPARTMENT OF COMMERCE
BUREAU OF THE CENSUS
SAM. L. ROGERS, DIRECTOR
MORTALITY STATISTICS 1918
NINETEENTH ANNUAL REPORT
CONTENT
TEXT
009,Introduction
...
049,CONTRIBUTORY CAUSES OF DEATH IN RELATION TO PRMARY CAUSES OF
DEATH in THE REGISTRATION AREA (EXCLUSIVE OF HAWAII AND OFSOLDIERS
SAILORS,AND MARINES):1917
SUMMARY AND RATE TABLES.
094,TABLE IA.--Deaths (exclusive of Stillbirths) in the registration area (exclusive of Hawaii),
its main subdivisions, each registration state (by cities and rural districts),
and each group of registration cities in nonregistration cities
096,TABLE IB--Deaths of nonresidents in relation to total deaths in each city and each
rural unit in the registration area (exclusive of Hawaii)
114,TABLE II--Deaths (exclusive of stillbirths) and death rates per 100,000 population,
by cause, according to the detailed International List, for the registration area
(exclusive of Hawaii) :1915 to 1918
118,TABLE III--Death rates per 100,000 population in the registration area (exclusive of Hawaii)
and each registration state, from important causes of death
GENERAL TABLES
123,TABLE 1.--Deaths (exclusive of stillbirths) in the registration area (exclusive of Hawaii)
and certain subdivisions,
---by month of death
133,TABLE 2.-- Deaths (exclusive of stillbirths) in the registration area (exclusive of Hawaii)
and certain subdivisions,
---by color, general nativity, and parent nativity
144,TABLE 3.--Deaths (exclusive of stillbirths) in the registration area (exclusive of Hawaii)
and certain subdivisions
---by color and age
170,TABLE 4.--Deaths (exclusive of stillbirths) in the registration area (exclusive of Hawaii),
its main subdivisions, and each registration state,
---by age, sex, color, general nativity, and parent nativity of decedent: 1918
206,TABLE 5.--Deaths (exclusive of stillbirths) in the registration area (exclusive of Hawaii) and certain subdivisions, by color of
decedent andcause of death: 1918
236,TABLE 6.--Deaths (exclusive of stillbirths) in the registration area (exclusive of Hawaii), its main subdivisions, and in cities and rural districts of each registration state,
---from each cause and class of causes
258,TABLE 7.--Deaths (exclusive of stillbirths) in the registration area (exclusive of Hawaii)
---from each cause and class of causes, by sex and age
270,TABLE 7A.-- = Table 7 for White persons
282,TABLE 7B.-- = Table 7 for Colored persons
294,TABLE 8.--Deaths (exclusive of stillbirths in the registration area (exclusive of Hawaii),
all registration states, and each registration state,
---from each cause and class of causes, by age of decedent:
432,TABLE 9.--Deaths (exclusive of stillbirths) in each city of 100,000 population or more in 1910,
---by cause of death (abridged International List) and by age
483,TABLE 10.--Deaths (exclusive of stillbirths) in the registration area (exclusive of Hawaii),
registration states, and cities of 100,000 population or more in 1910,
---from important causes, by month of death
521,TABLE 11.--Deaths (exclusive of stillbirths) in the registration area (exclusive of Hawaii),
registration states, and cities of 100,000 population or more in 1910,
from important causes, for certain subdivisions of the fist year of life
MAPS.
008,Growth of the registration area for deaths: 1880 to 1918
DIAGRAMS.
010,Percentages which the population and land area of the registration area formed of the
total population and land area of the United States for the years 1880, 1890, and 1900 to 1918
010,Per cent of deaths in the registration area (exclusive of Hawaii) by color, by nativity
of white persons, and by parent nativity of the native white: 1918
012,Number of deaths in the registration area (exclusive of Hawaii) at all ages, under 1 year of age,
and from 1 to 4 years of age, for each of the years 1900 to 1918
012,Per cent of deaths in the registration area (exclusive of Hawaii) under 1 year of age,
from 1 to 4 years, and 5 years and over, for each of the years 1900 to 1918
016, General death rates of the United States (registration area) and certain foreign countries
for each of the years from 1900 to 1917
022,Death rates from certain important causes of death in the registration area of the United States
for each of the years from 1900 to 1918
SUPPLEMENT.
574,HAWAII
589,SOLDIERS, SAILORS, AND MARINES
594,ADDITIONAL DEATHSLeave a comment:
-
Re: 1918 Analysis with Charts and Graphs
there are lots of genealogy, family finder , historical heritage databases now.
But not for research !
They do have the data, they could easily show daily time-series of deaths by age-groups,
maybe even by cause of death for cities,counties,states.
From 1918 and earlier.
E.g. here for Kentucky 1911-2000, ~3M records, 43711 for 1918
but they forbid to download in bulk
Missouri 1910-1962
but only by date and location, not by age or cause of death
Missouri 1880-1910 with age
Missouri seems to allow bulk download and posting the charts here ?!
picture below:
1914-1921, MA28,daily deaths from all causes
the data for <1910 is bad, not computer-readable, many gaps
-------------------------------------------------------------
--------------------------------------------------------------------
1889-1890 :
.................................................. ...................Attached FilesLeave a comment:
-
-
Re: 1918 Analysis with Charts and Graphs
from a friend of FTOriginally posted by gsgs View Post
1857 saw the last major swedish dysenteri epidemic and cholera epidemic which may in part explain the dip. 1857: Dysentery 10650 Cholera 3961 Pop 3680295 Deaths 101491
Cholera figures here: http://landberga.se/medicinhistoria/kolera.html
Dysentery figures here: http://www2.hist.uu.se/historikermot...stenbrandt.pdf (graph showing dysentery mortality as a percentage of total mortality)
No tuberculosis data due to changes in death cause registartion between 1831 and 1859Leave a comment:
-
Re: 1918 Analysis with Charts and Graphs
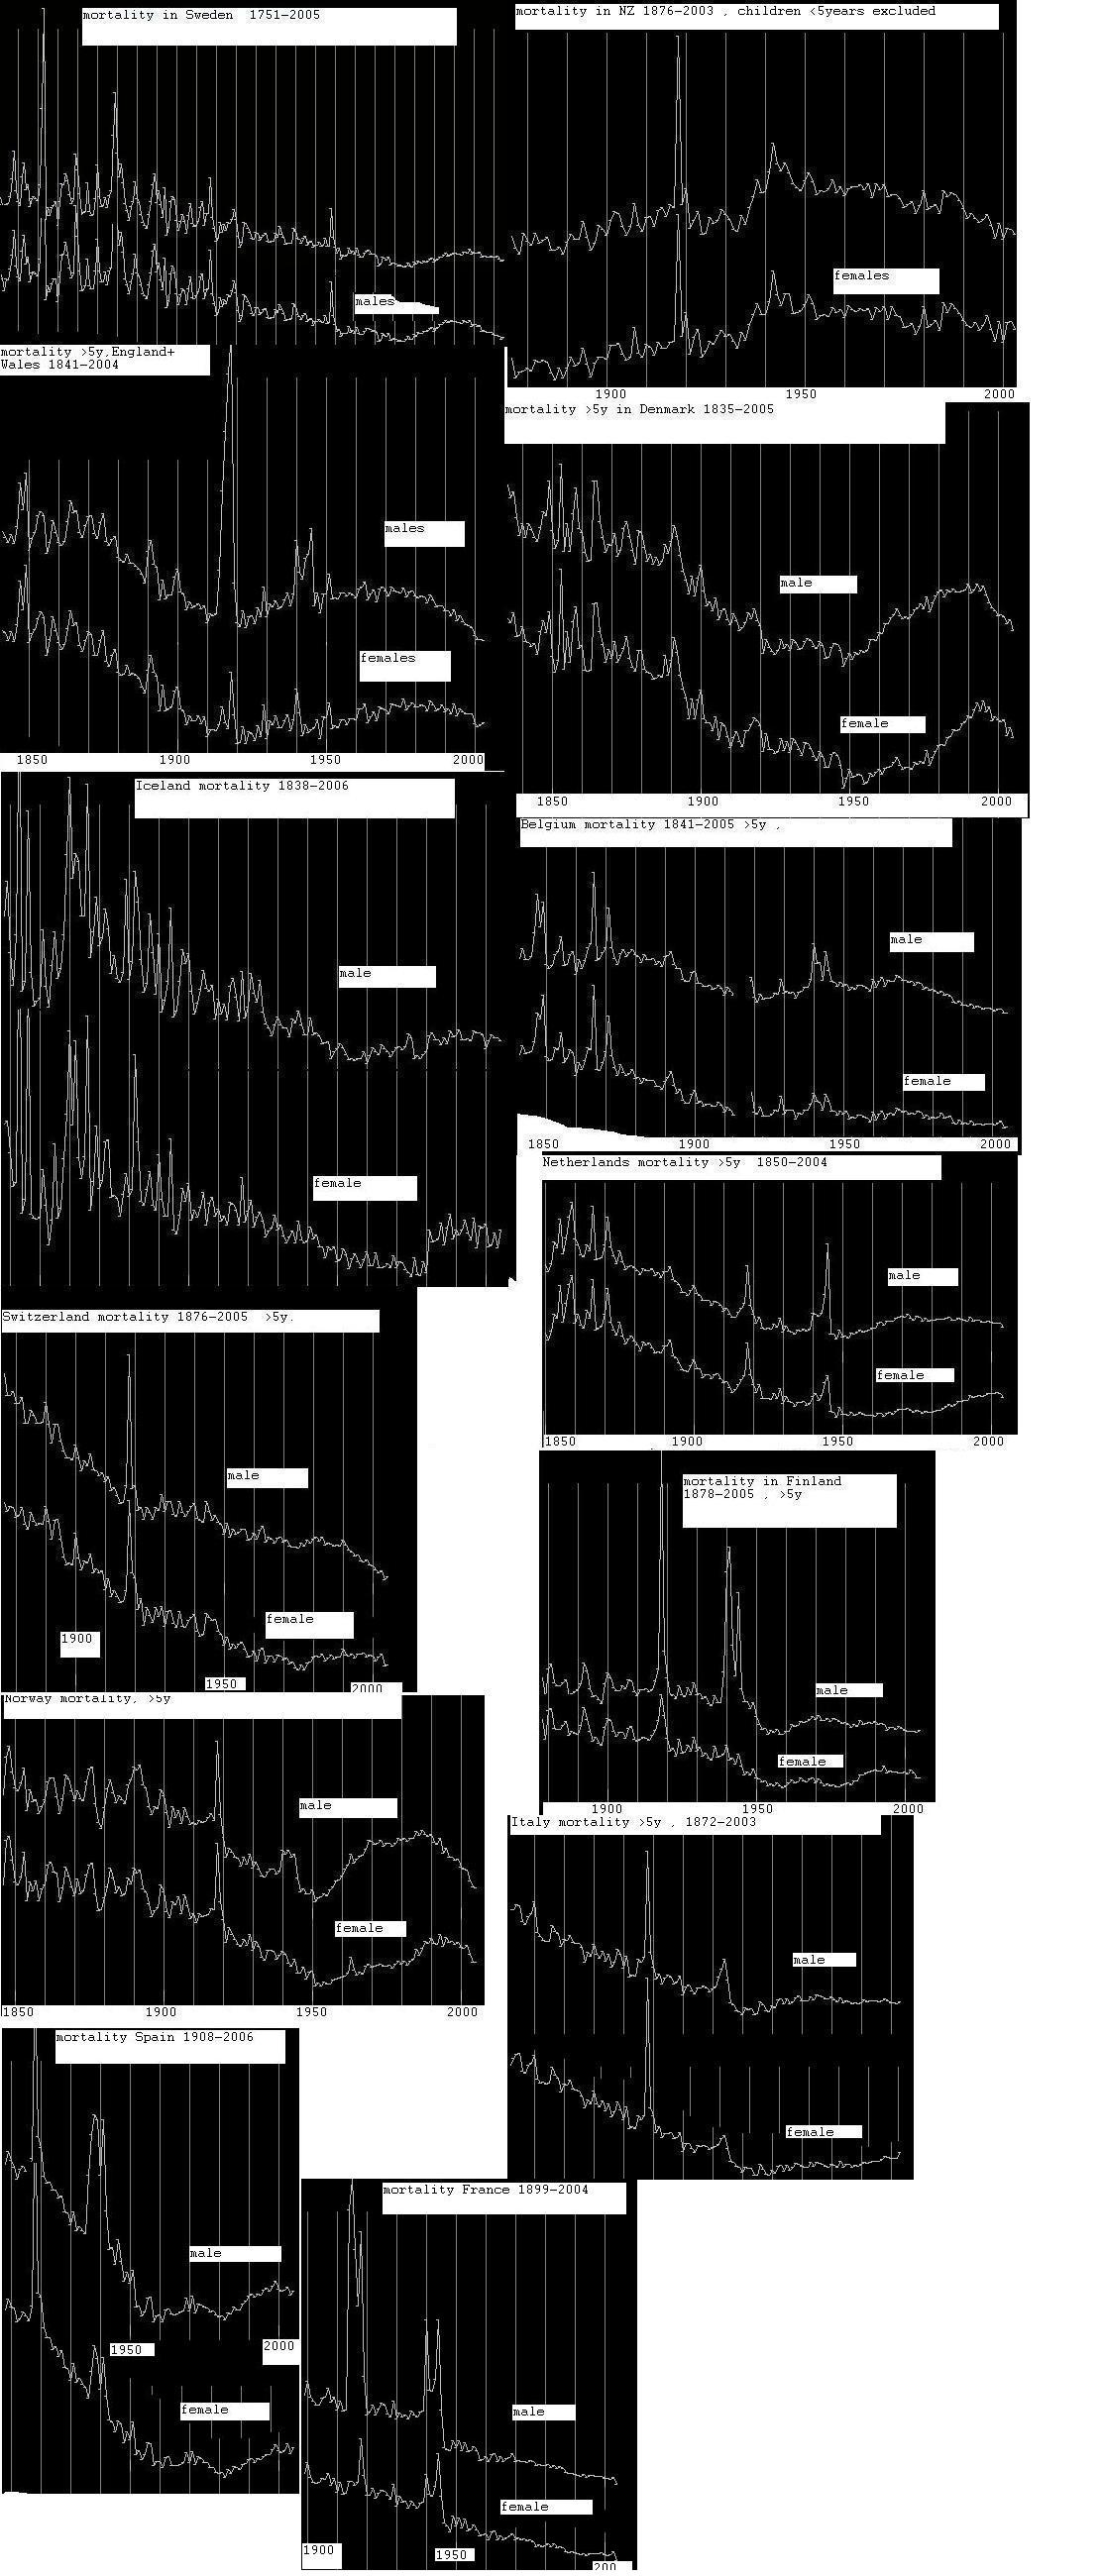
collection of mortality figures in several countries:
Leave a comment:
-
Re: 1918 Analysis with Charts and Graphs
Originally posted by gsgs View Post
I believe there is a 9.54 Mb upload limit for pdf files here at FT.Leave a comment:
-
Re: 1918 Analysis with Charts and Graphs
I have some of the .pdfs on my HD, is it appropriate to
upload to FT ?Leave a comment:
-
Re: 1918 Analysis with Charts and Graphs
I couldn't even get anything from your first link using the Wayback Machine.
Maybe they haven't removed them permanently.Leave a comment:
-
Re: 1918 Analysis with Charts and Graphs
apparantly the State Library of North Carolina has removed most of their influenza 1918 documents.
3 documents are still here:

here a bibliography:
Leave a comment:
-
Re: 1918 Analysis with Charts and Graphs
Looks like the men's life expectancy corresponds with the Russo-Ottoman wars. Dates from Wikipedia, http://en.wikipedia.org/wiki/Russo-T...War,_1710-1711
1568?70 ? 1571?72 ? 1676?81 ? 1686?1700 ? 1687?89
1695?96 ? 1710?11 ? 1735?39 ? 1768?74 ? 1787?92
1806?12 ? 1821?29 ? 1828?29 ? 1853?56 (Crimean War)
1877?78 ? 1914?17 (World War I) ? 1917?18
I wonder what caused the 2 small increases for women prior to 1850? And why have they been declining since the '80's?Leave a comment:
-
Re: 1918 Analysis with Charts and Graphs
life expectancy Sweden by year of death

{1773 famine , 1809 war , 1857 influenza? , 1918 influenza pandemic}
hard to imagine that this stable trend since 1950 should suddenly reverse now...Leave a comment:
-
Re: 1918 Analysis with Charts and Graphs
I mean, people 5-45 years old won't usually die in 1918 from influenza
without also having bacterial pneumonia, (I think)
Or cyanosis/cytokene storm.
So I assume the doctor often had the choice to write
"influenza" or "pneumonia" as cause of death.Leave a comment:
-
Re: 1918 Analysis with Charts and Graphs
hi gsgs, I don't understand what you mean :
Of cause, when people die from H1N1-influenza, what else can be
the direct cause than pneumonia ? (besides cyanosis)Leave a comment:


Leave a comment: