Weekly U.S. Influenza Surveillance Report
Updated June 17, 2022
The Week 23 (ending June 11, 2022) FluView report is the last full FluView report of the 2021-2022 season. An abbreviated report will be published during the summer, and the first full report of the 2022-23 season will be published on October 14, 2022.

Note: CDC is tracking the COVID-19 pandemic in a weekly publication called COVID Data Tracker Weekly Review.
Key Updates for Week 23, ending June 11, 2022
Seasonal influenza activity is decreasing nationally.
Viruses
Clinical Lab3.4%
positive for influenza
this week
Public Health Lab
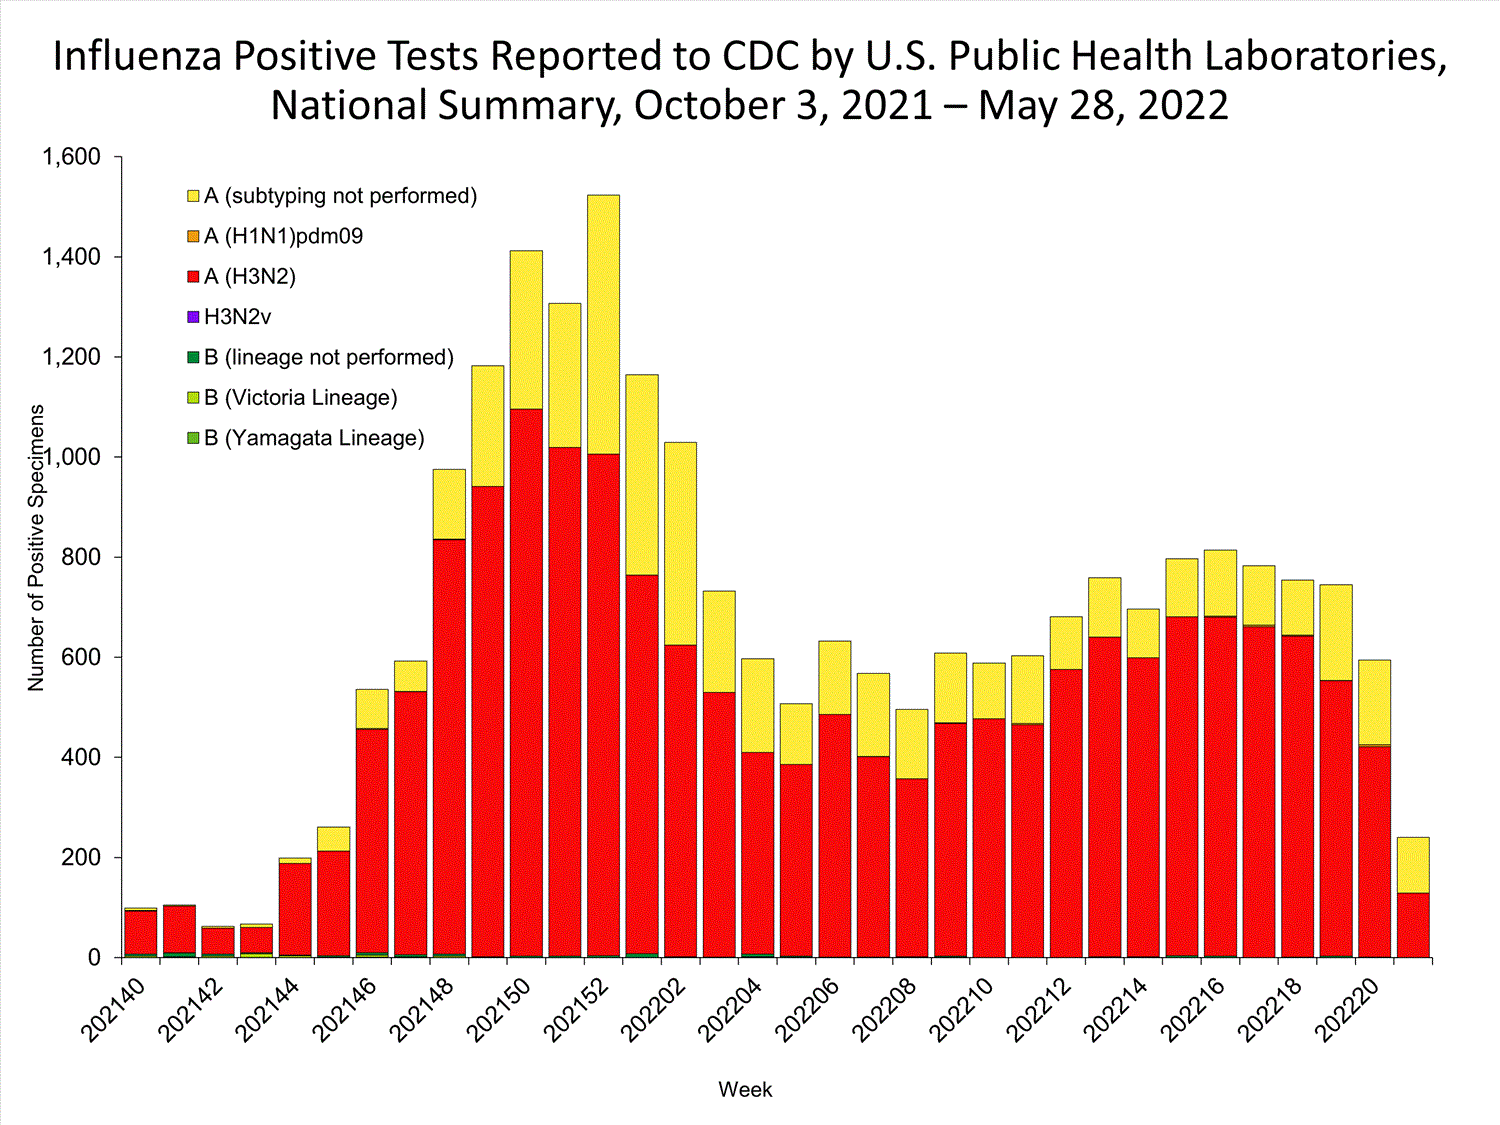
The majority of viruses
detected are influenza A(H3N2).
Virus Characterization
Genetic and antigenic characterization and antiviral susceptibility are summarized in this report.
Illness
Outpatient Respiratory Illness2.1%
of visits to a health care provider are for respiratory illness this week
(below baseline)
Outpatient Respiratory Illness: Activity Map
This week, 3 jurisdictions experienced high activity and 0 jurisdictions experienced very high activity.
Long-term Care Facilities0.4%
of facilities reported
≥ 1 influenza-positive test
among residents this week.
Severe Disease
FluSurv-NET17.1 per 100,000
cumulative hospitalization rate
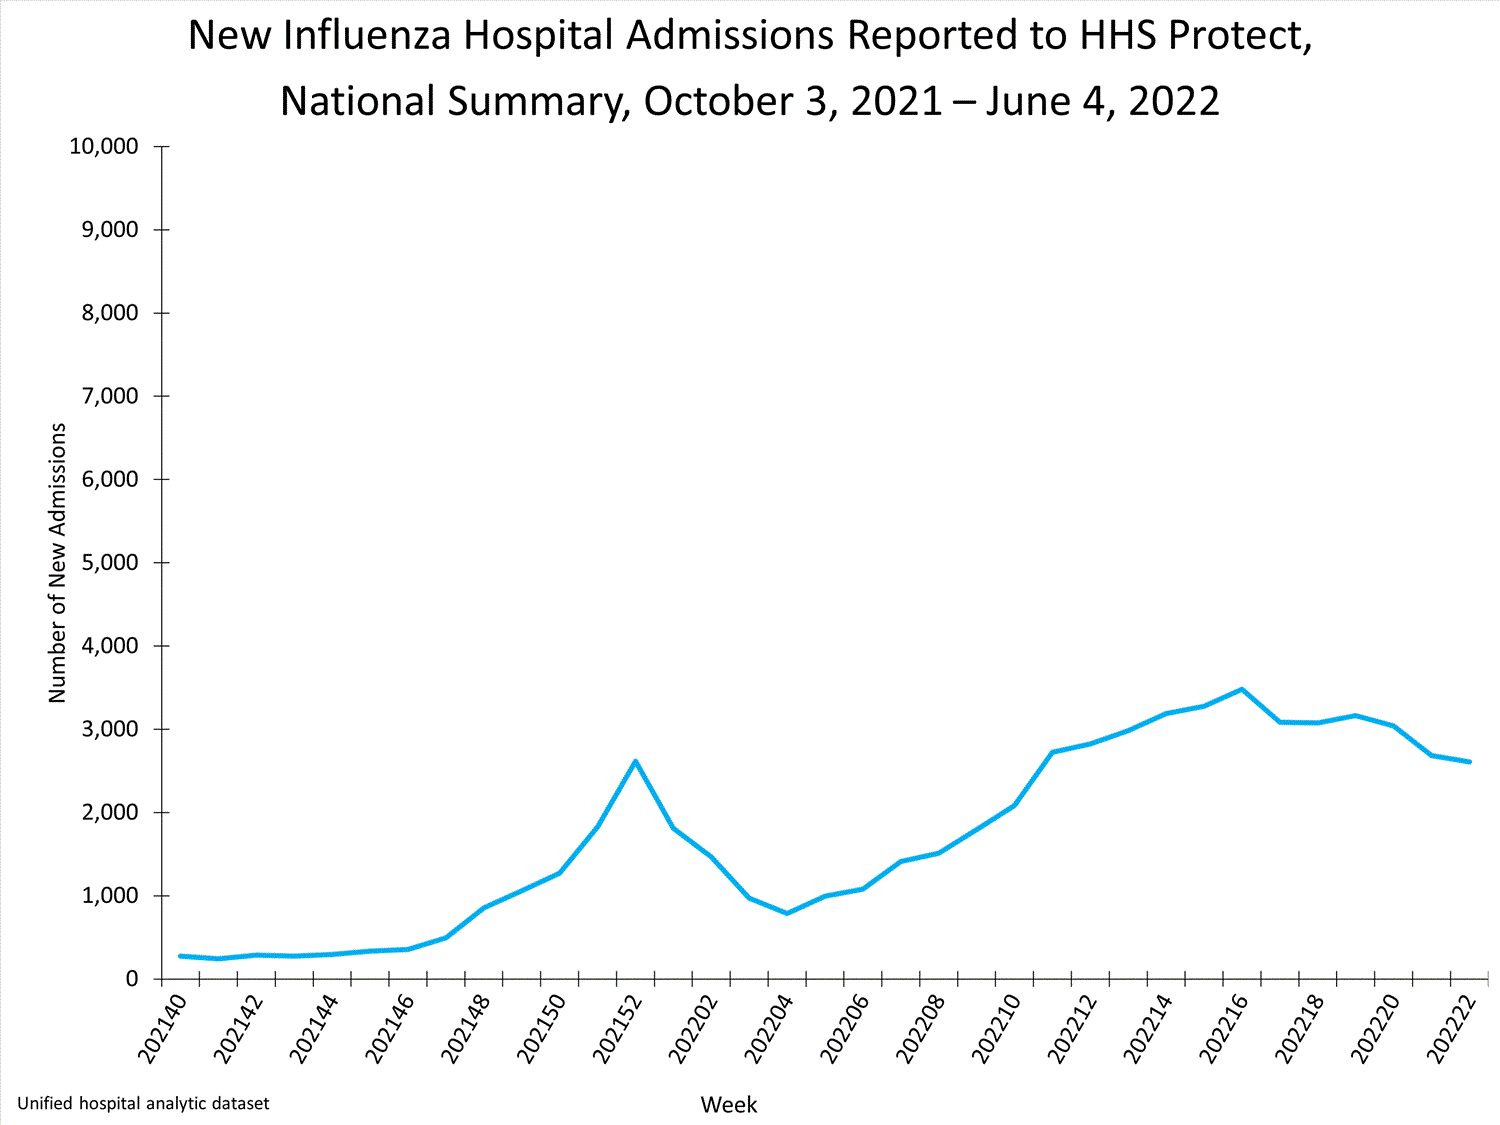
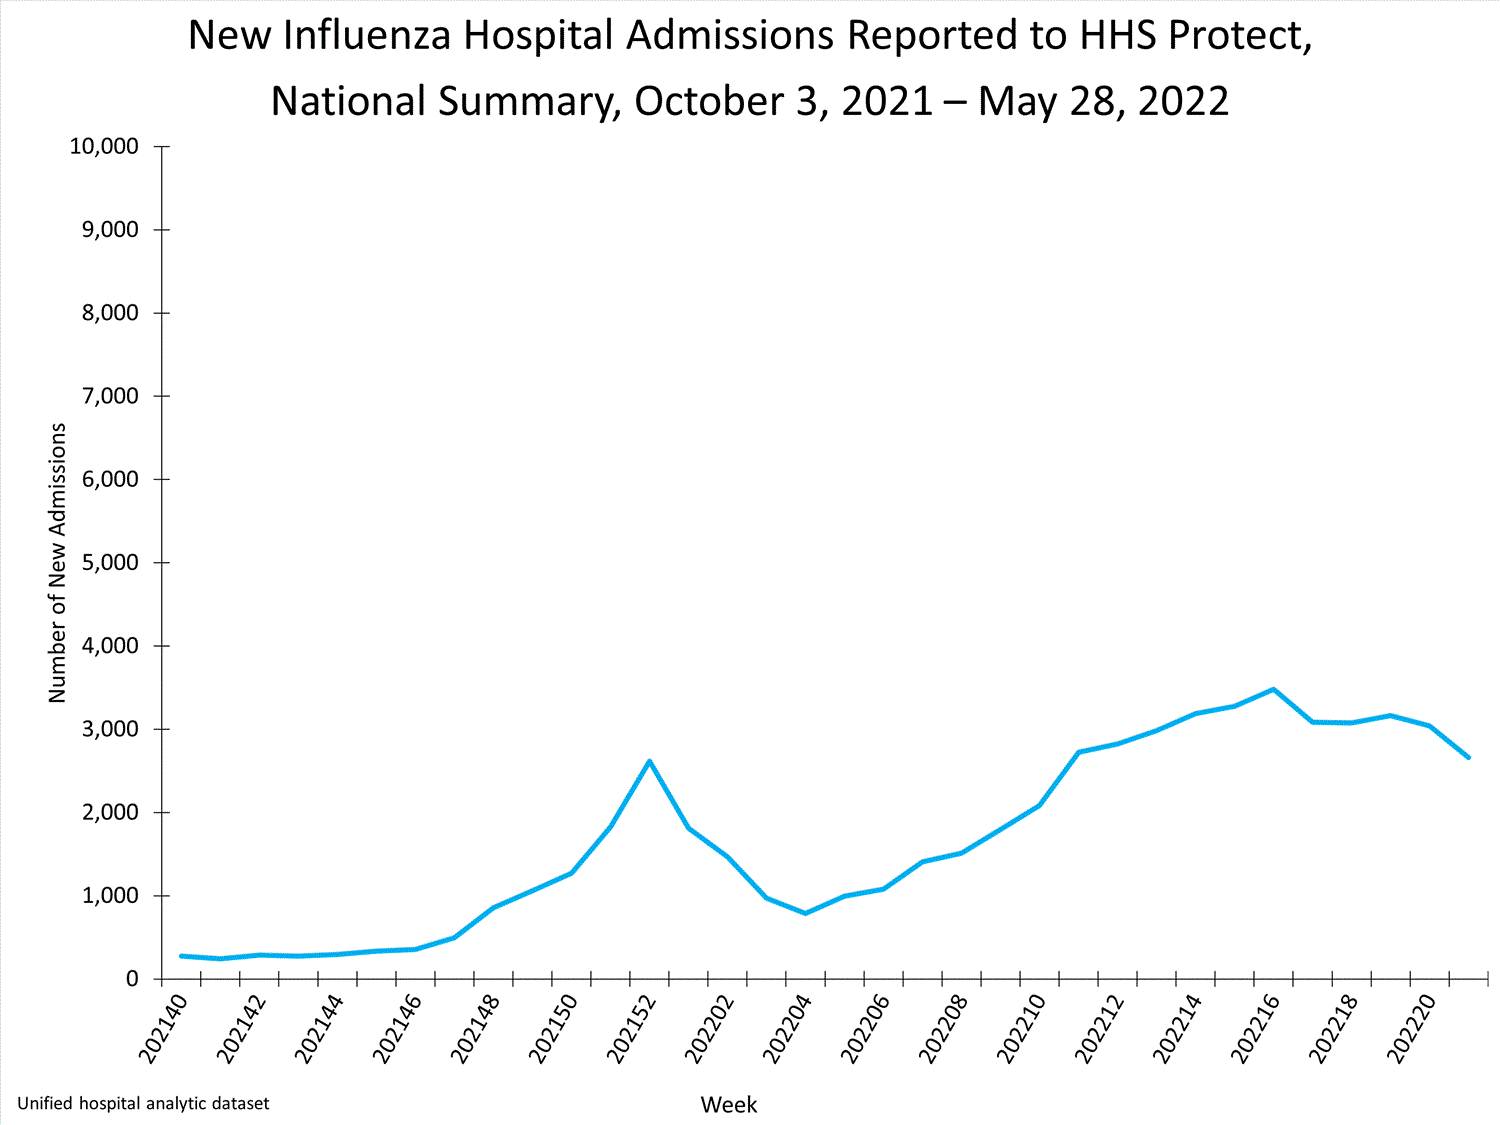
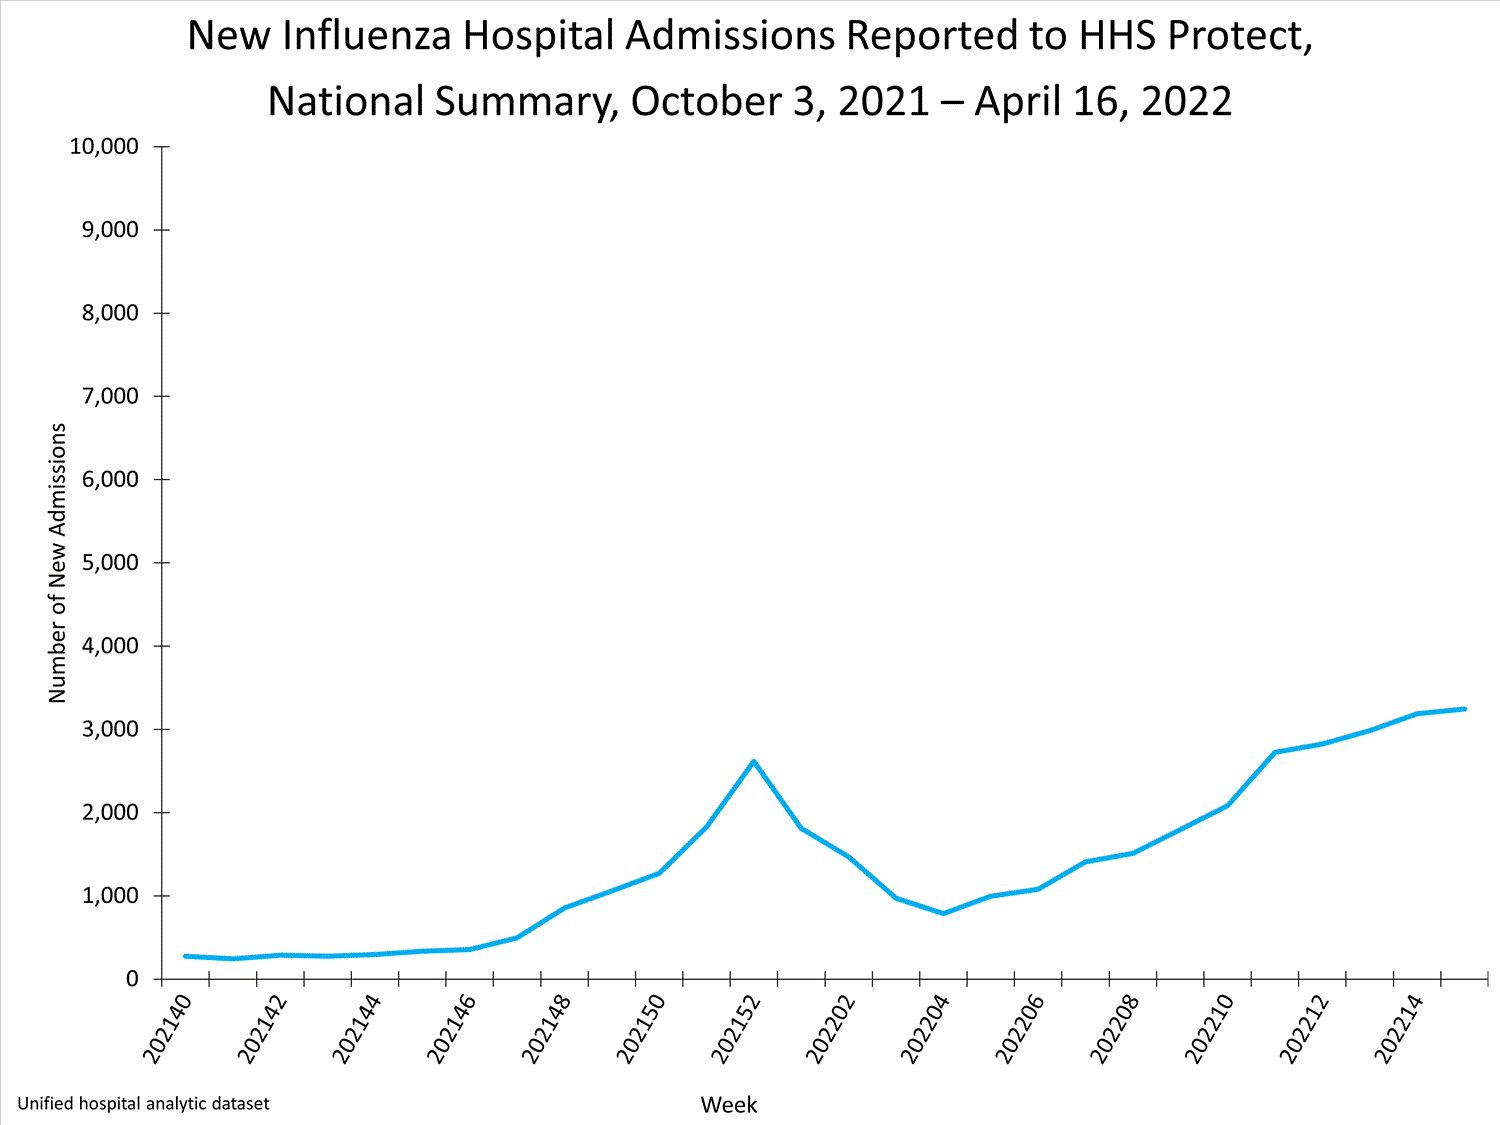
HHS Protect Hospitalizations2,089
patients admitted to hospitals with influenza
this week.
NCHS Mortality
No report this week due to system-wide coding upgrade.
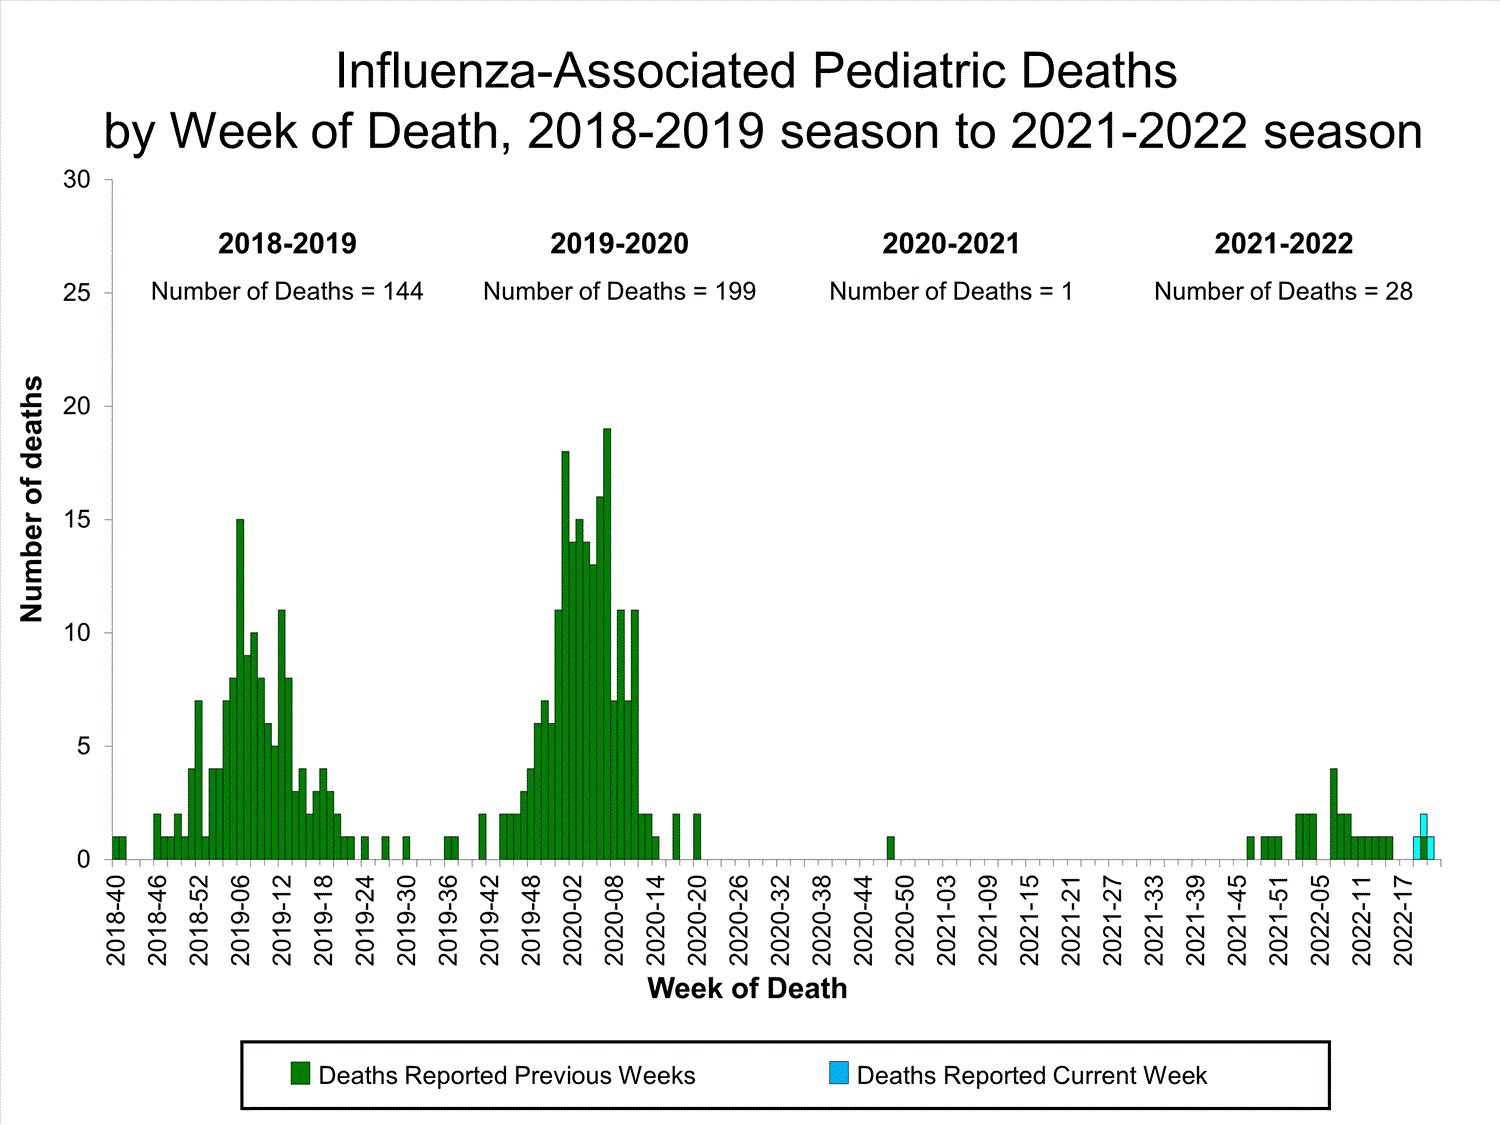
Pediatric Deaths1
influenza-associated death reported this week with a total of 29 so far this season
All data are preliminary and may change as more reports are received.
A description of the CDC influenza surveillance system, including methodology and detailed descriptions of each data component is available on the surveillance methods page.
Additional information on the current and previous influenza seasons for each surveillance component are available on FluView Interactive.
Key Points
- Seasonal influenza activity is decreasing nationally.
- This week is the last full version of FluView for the 2021-2022 influenza season. Starting with week 24, an abbreviated summer version of FluView will be published. The full version is expected to resume for week 40 of 2022, which is the start of the 2022-2023 influenza season.
- The majority of influenza viruses detected are A(H3N2). H3N2 viruses identified so far this season are genetically closely related to the vaccine virus. Antigenic data show that the majority of the H3N2 viruses characterized are antigenically different from the vaccine reference viruses. While the number of B/Victoria viruses circulating this season is small, the majority of the B/Victoria viruses characterized are antigenically similar to the vaccine reference virus.
- The percentage of outpatient visits due to respiratory illness has decreased compared to last week and has trended downward over the past four weeks. Influenza is contributing to levels of respiratory illness, but other respiratory viruses are also circulating. The relative contribution of influenza varies by location.
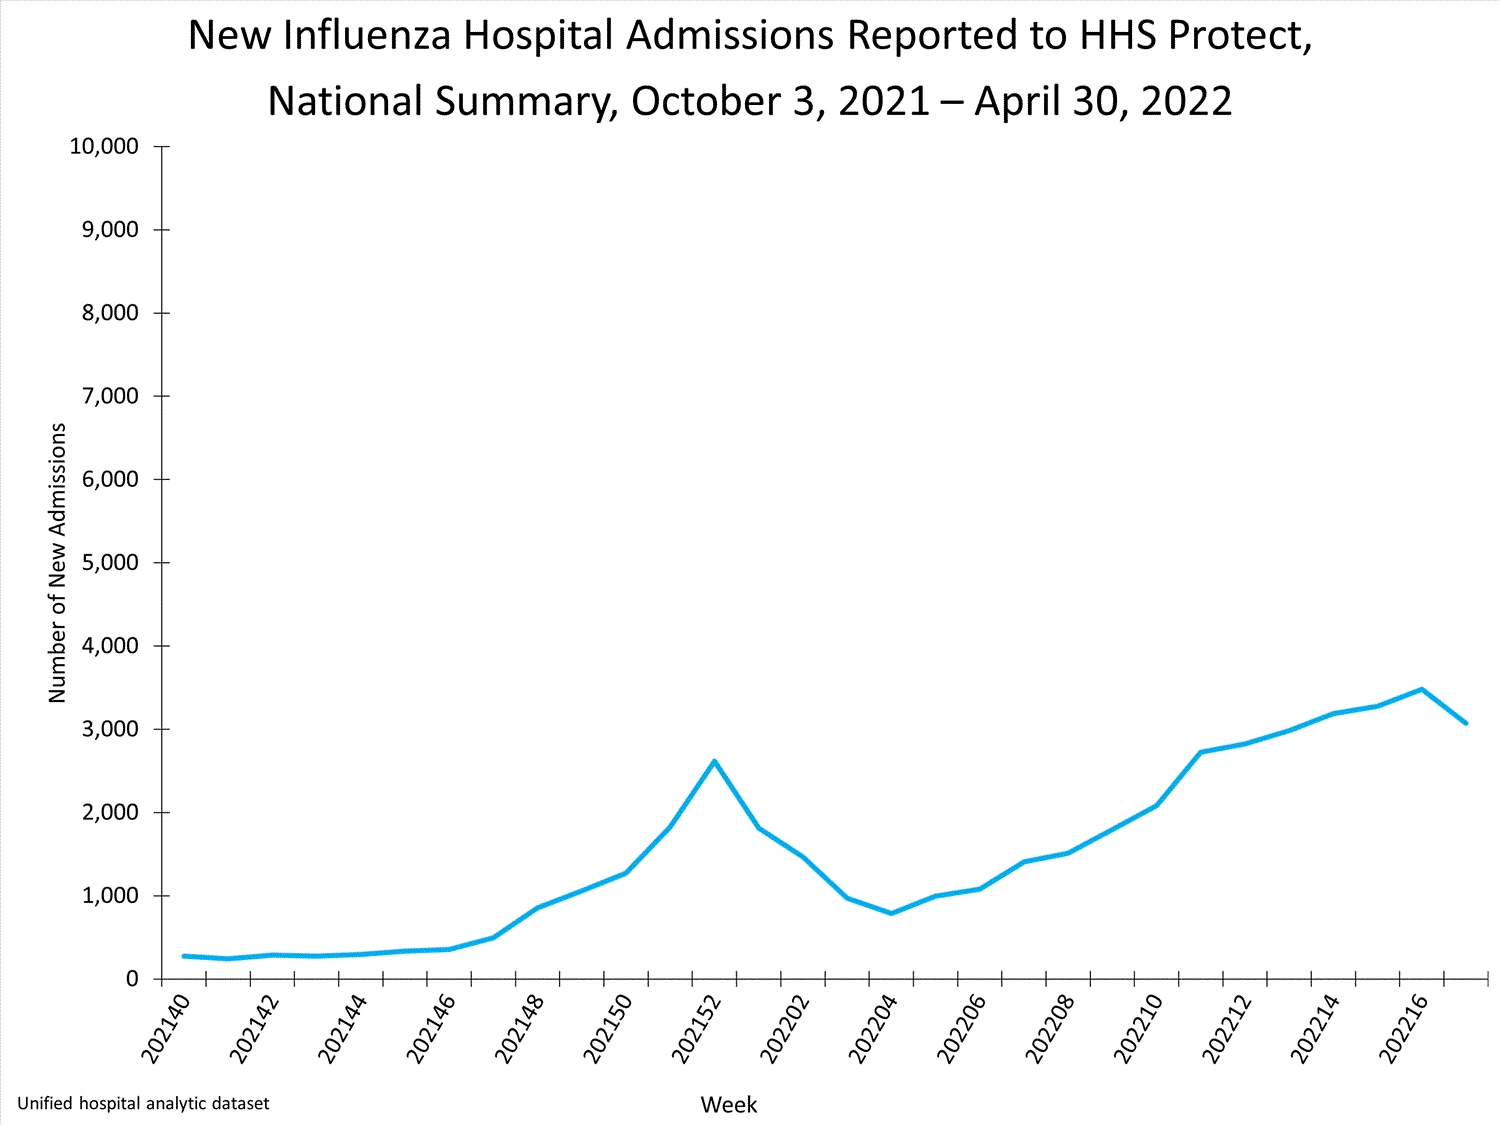
- The number of hospital admissions with laboratory confirmed influenza that were reported to HHS Protect decreased compared to last week and has been trending downward since late April.
- Due to late-season activity during the 2021-2022 season, FluSurv-NET surveillance was extended beyond the typical end date of April 30 (MMWR Week 17) to June 11 (MMWR Week 23). As of MMWR Week 23, the overall cumulative hospitalization rate was 17.1 per 100,000 population, and the overall weekly hospitalization rate was 0.3 per 100,000 population.
- One influenza-associated pediatric death was reported this week. A total of 29 influenza-associated pediatric deaths occurring this season have been reported.
- CDC estimates that, so far this season, there have been at least 8 million flu illnesses, 82,000 hospitalizations, and 5,000 deaths from flu.
- An annual flu vaccine is the best way to protect against flu. Vaccination can prevent serious outcomes in people who get vaccinated but still get sick. CDC continues to recommend that everyone ages 6 months and older get a flu vaccine as long as flu activity continues.
- There are also prescription flu antiviral drugs that can be used to treat flu illness.
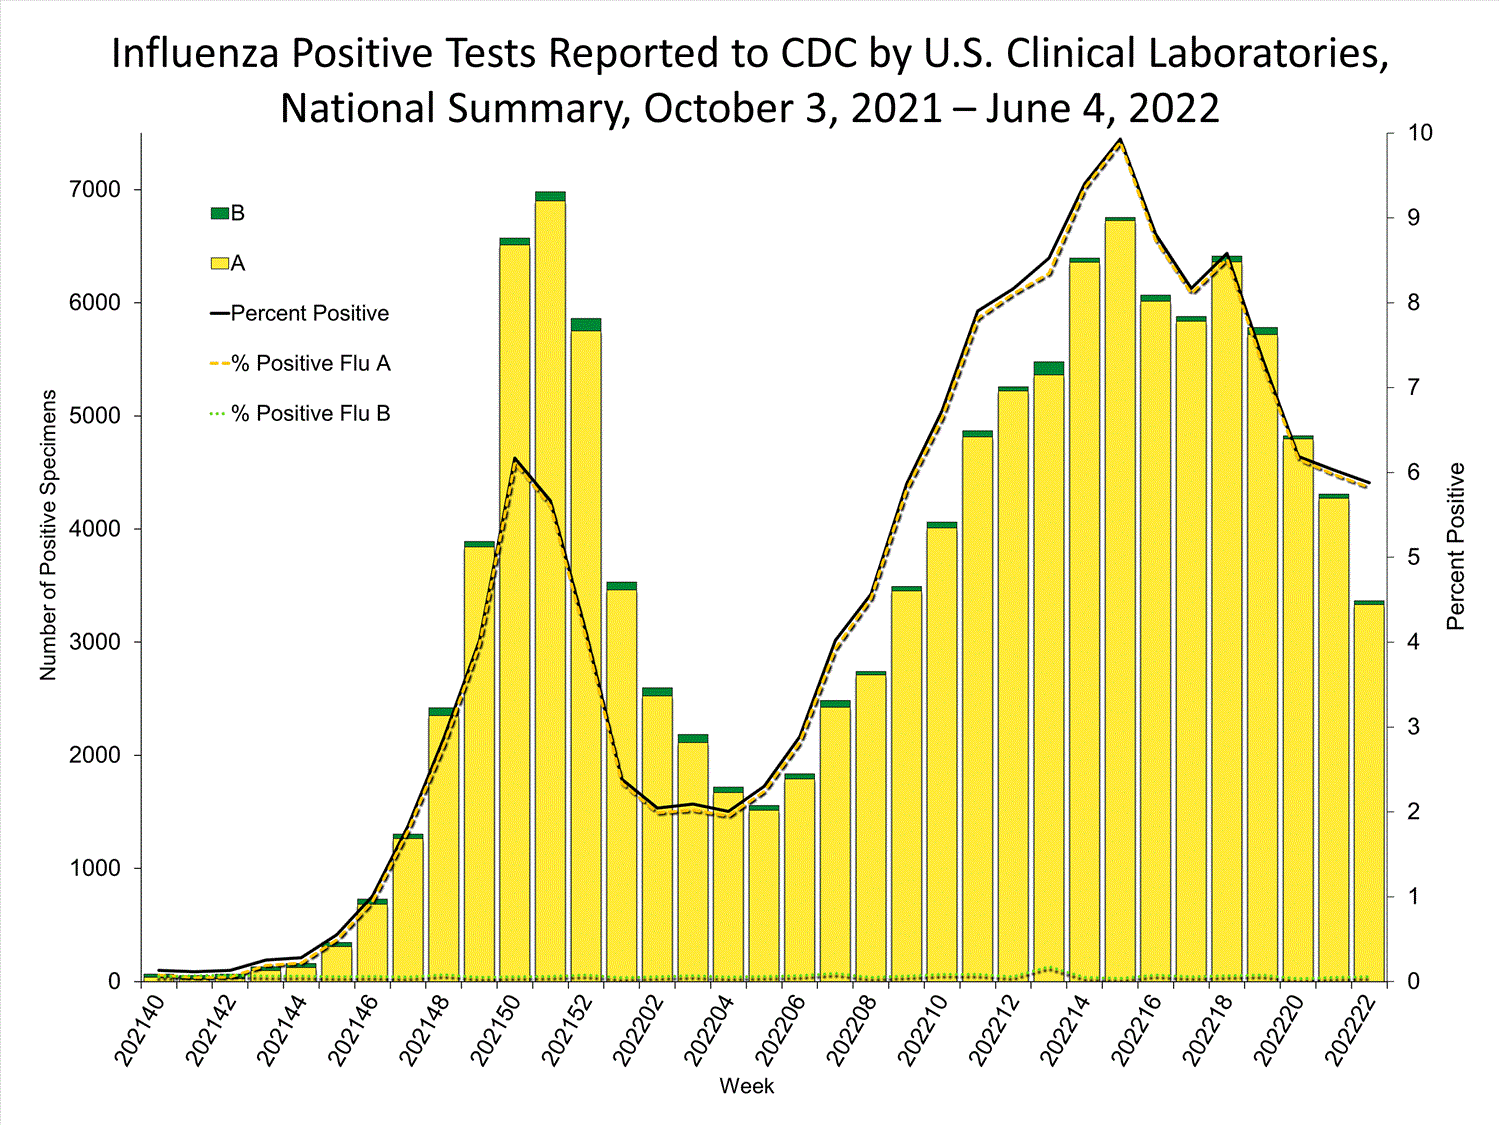
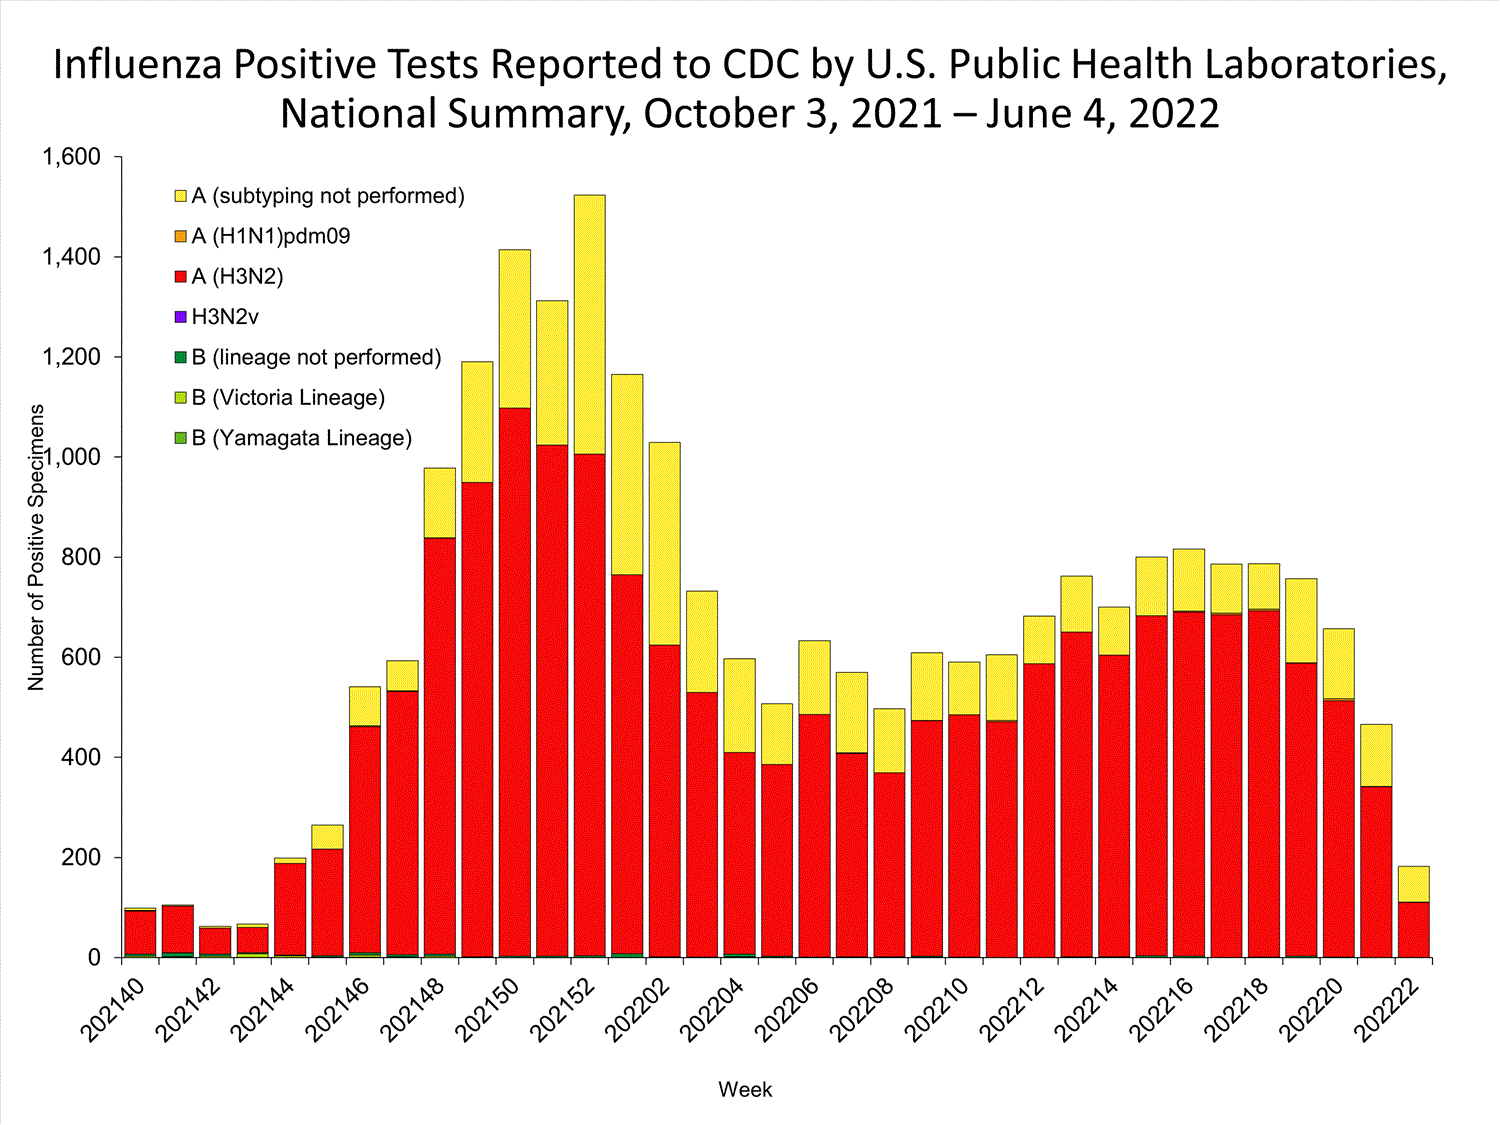
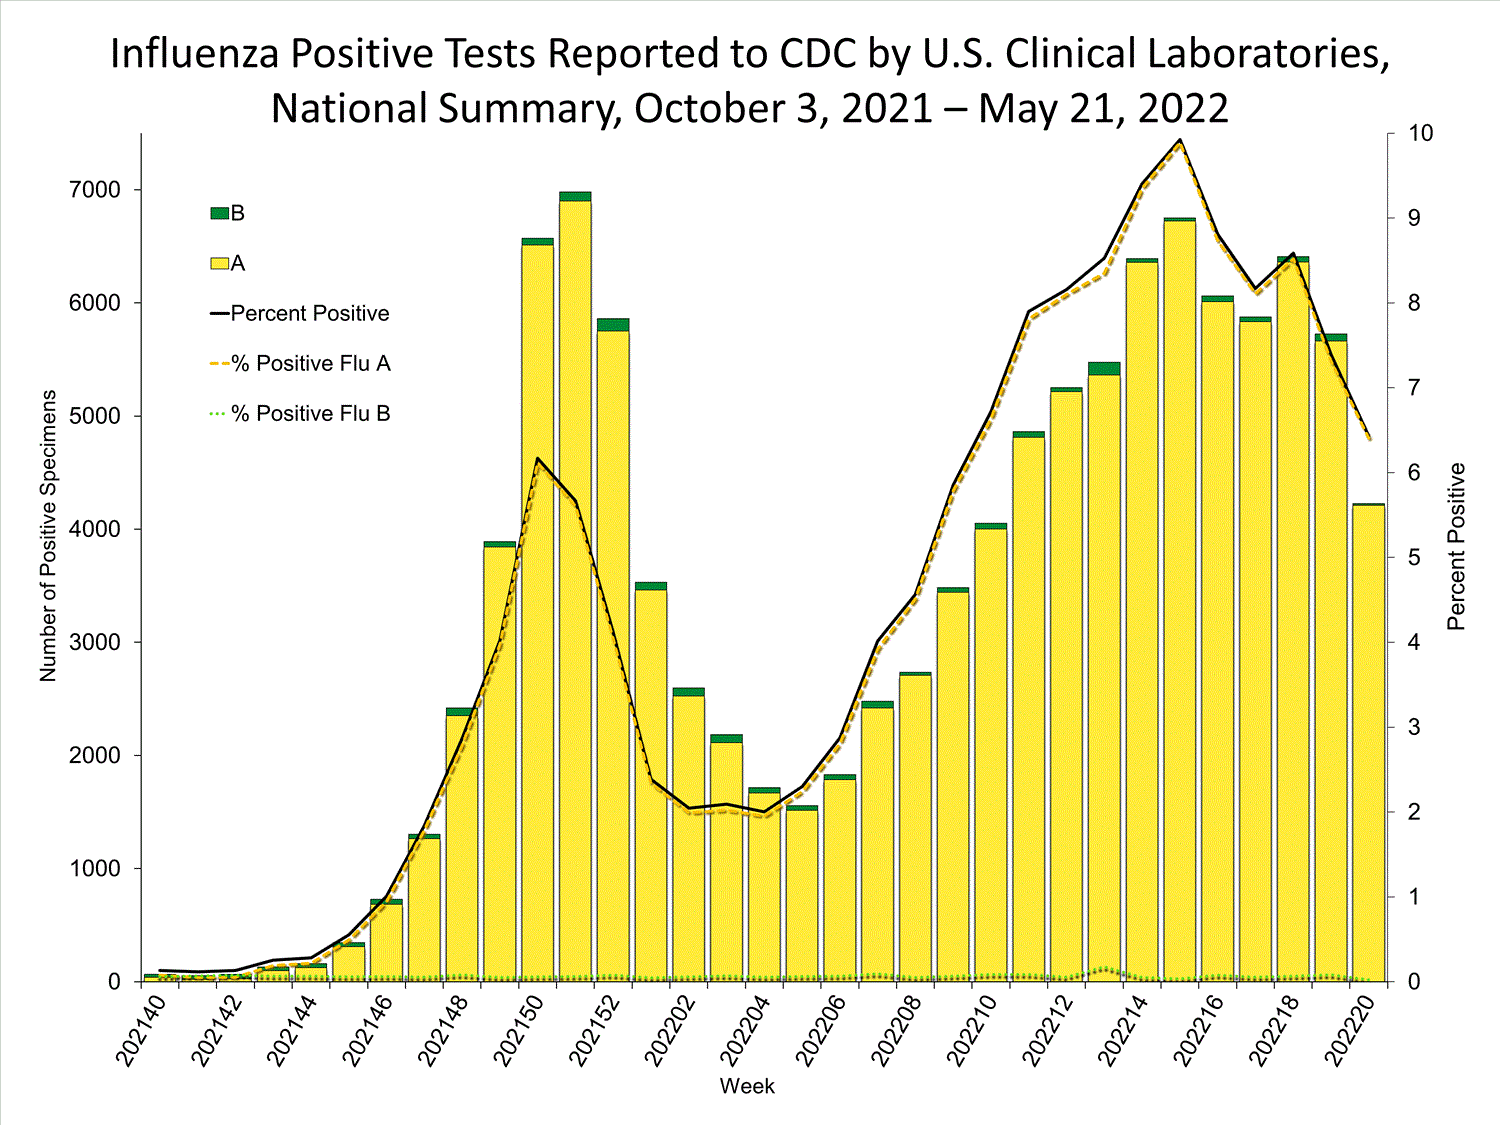
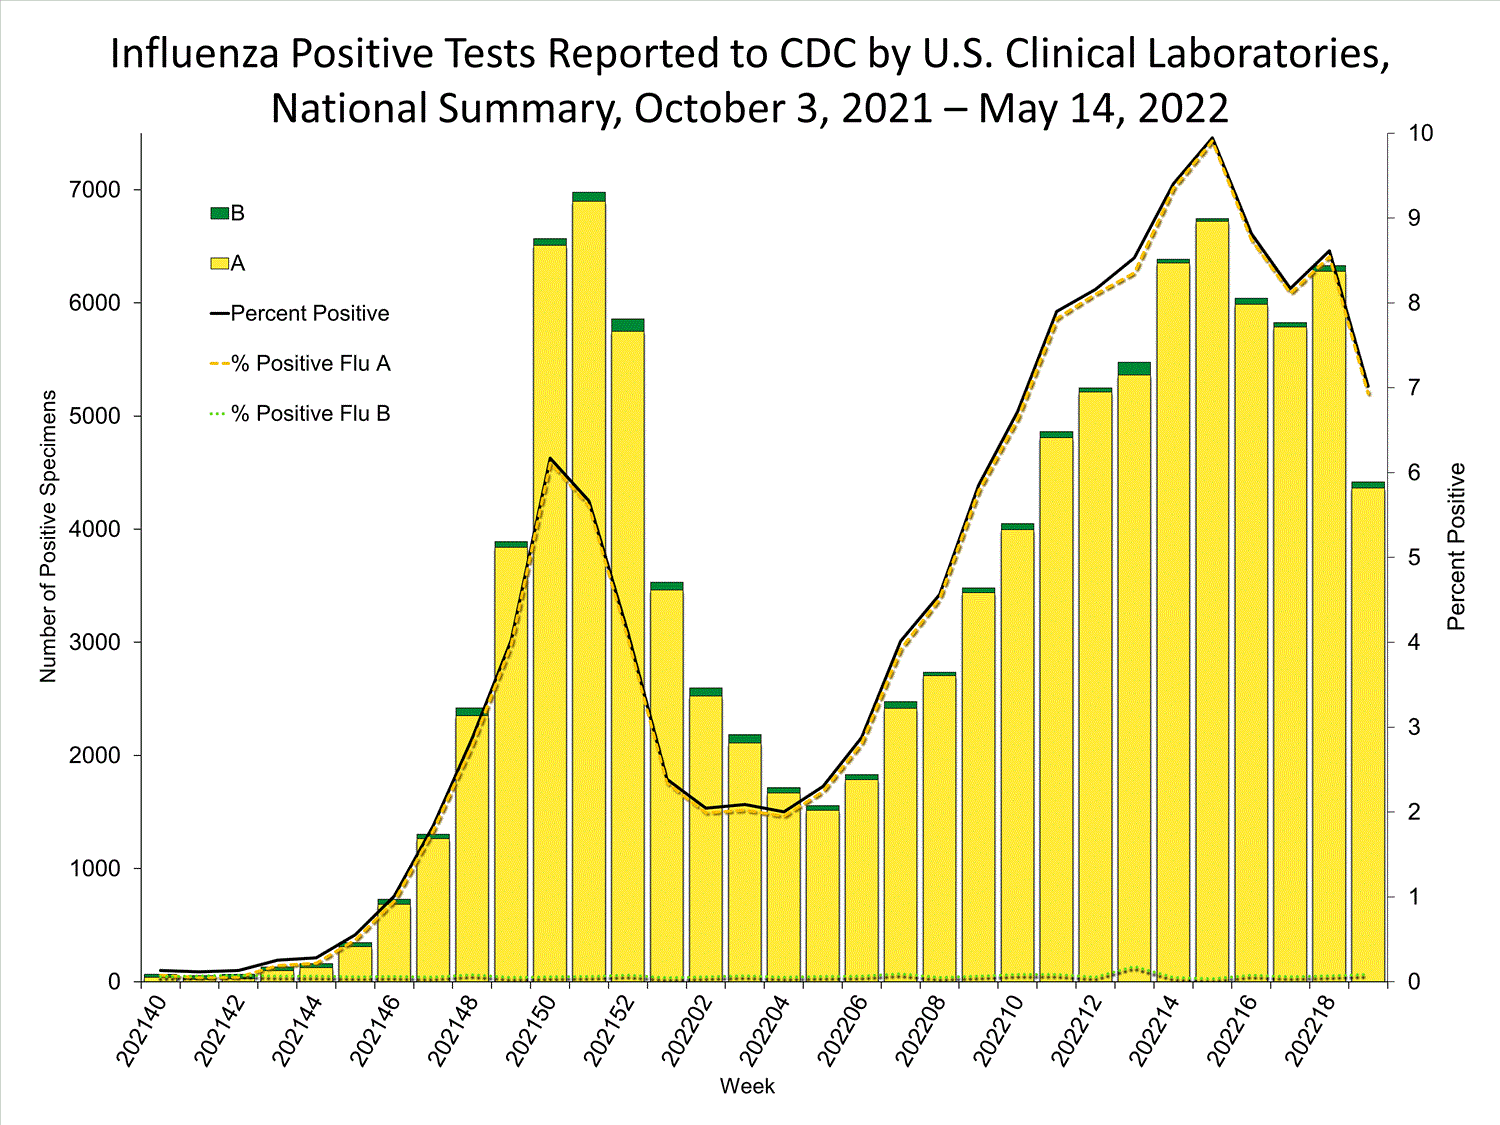
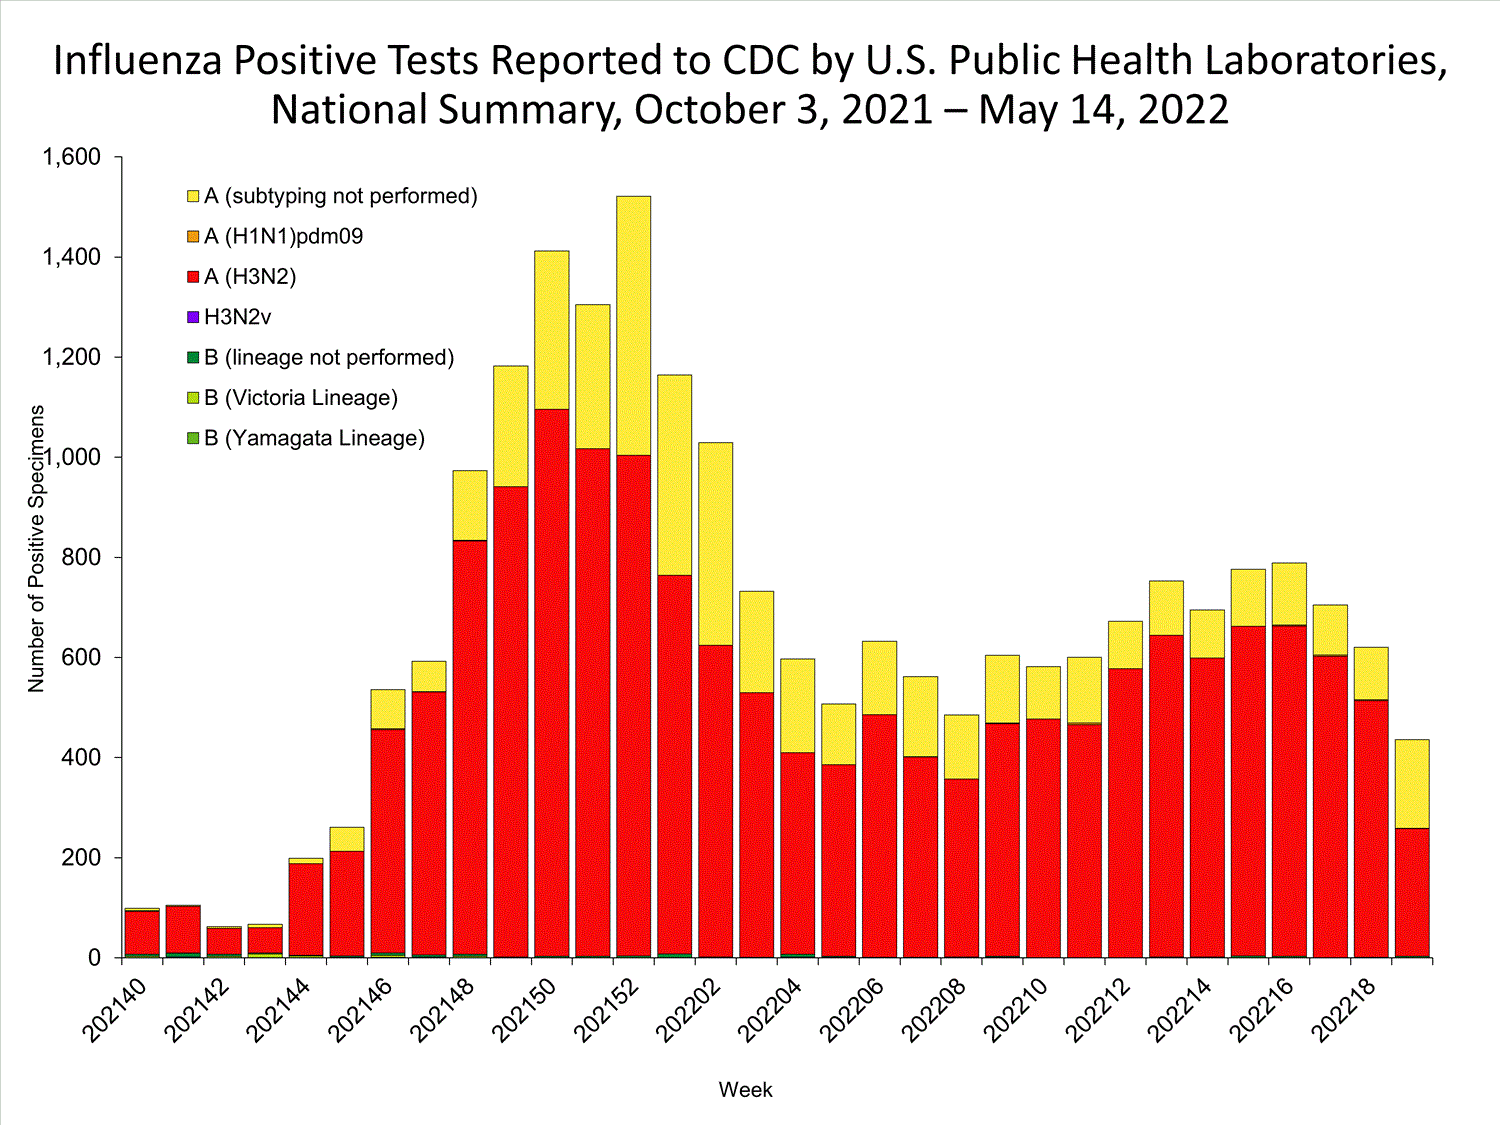
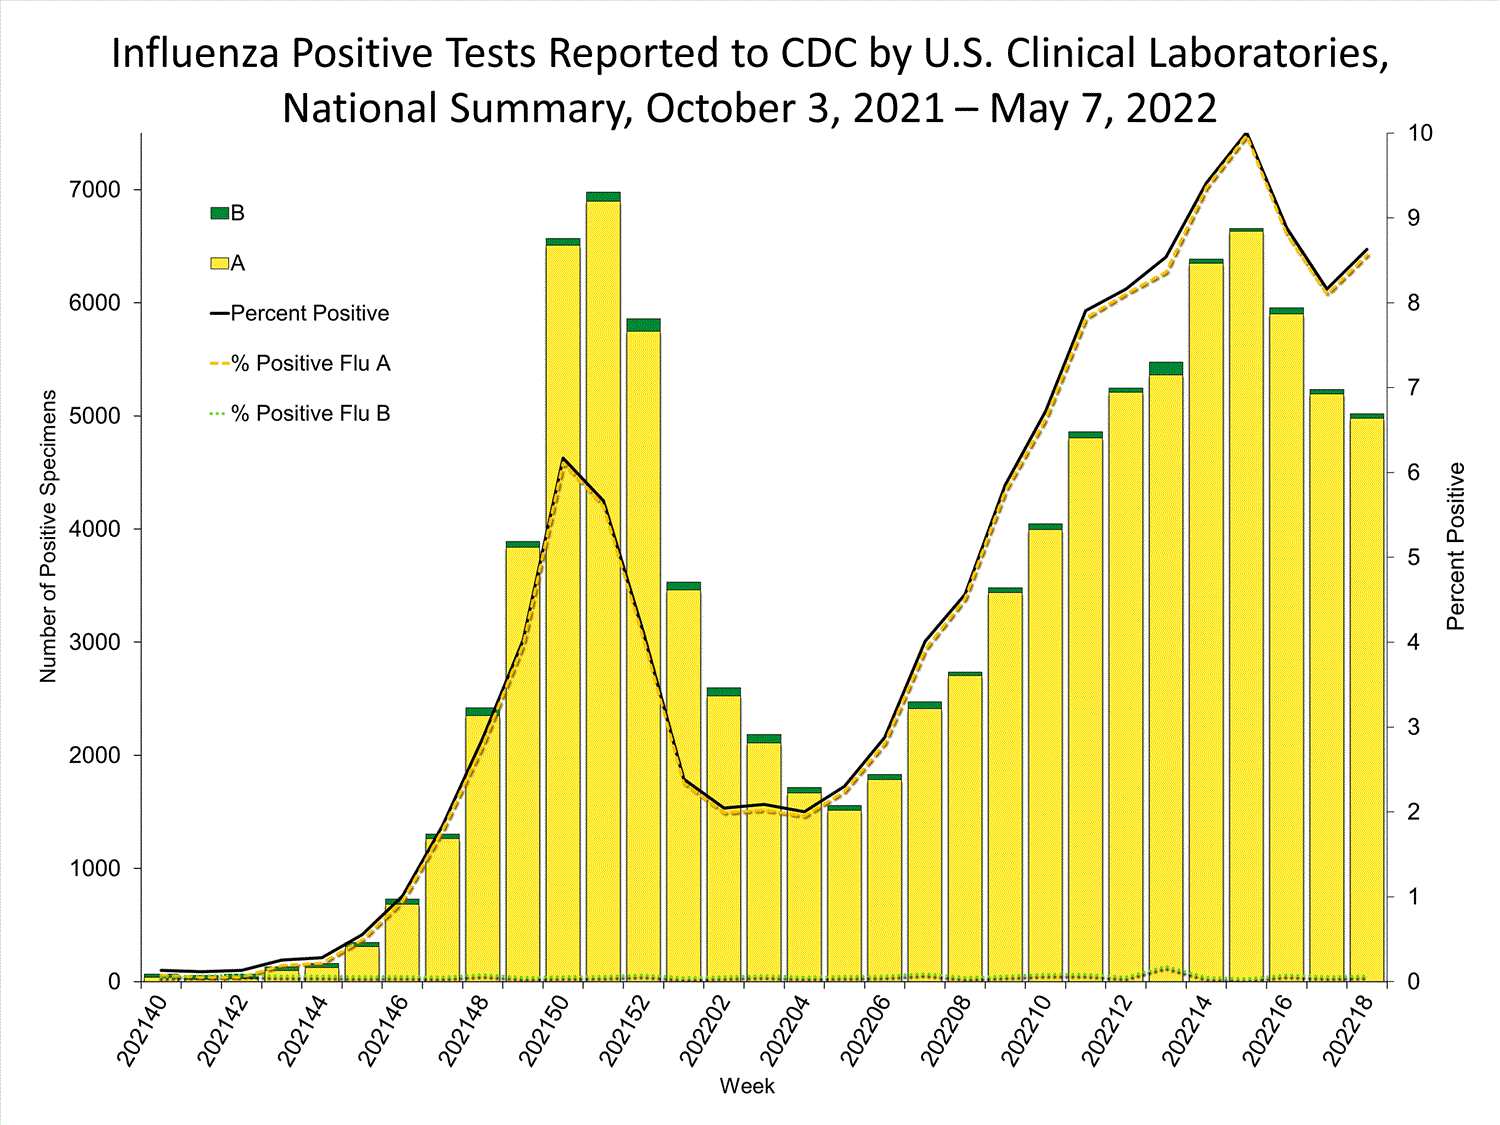
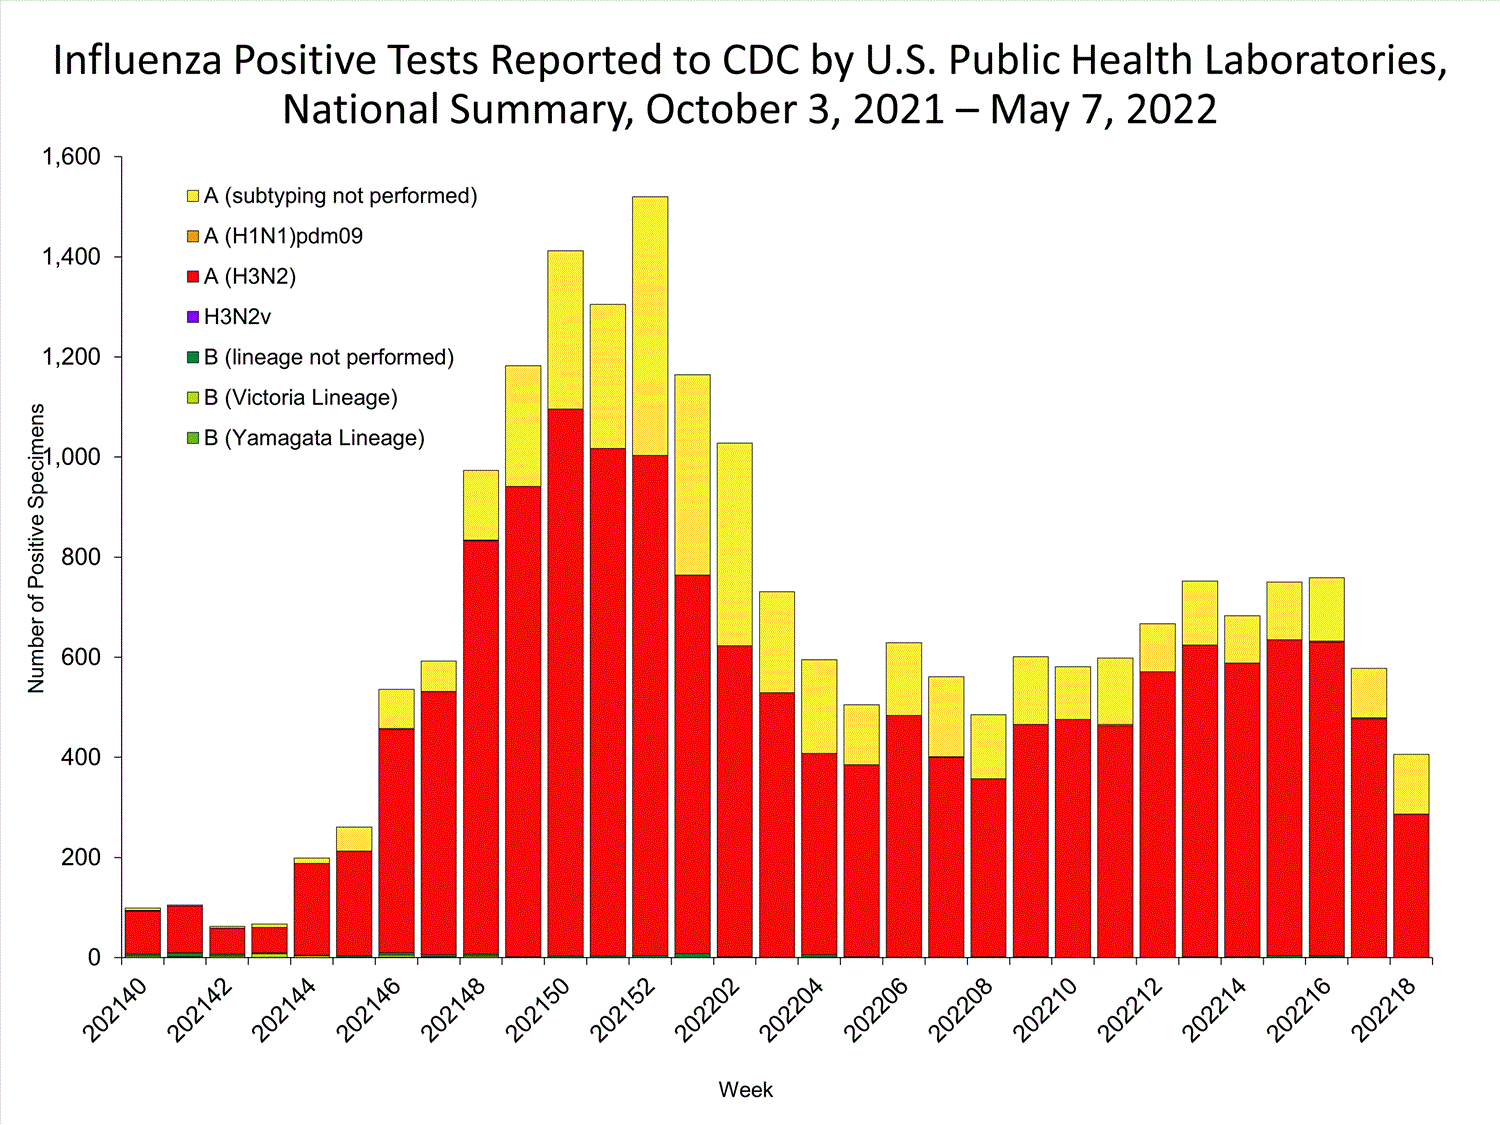
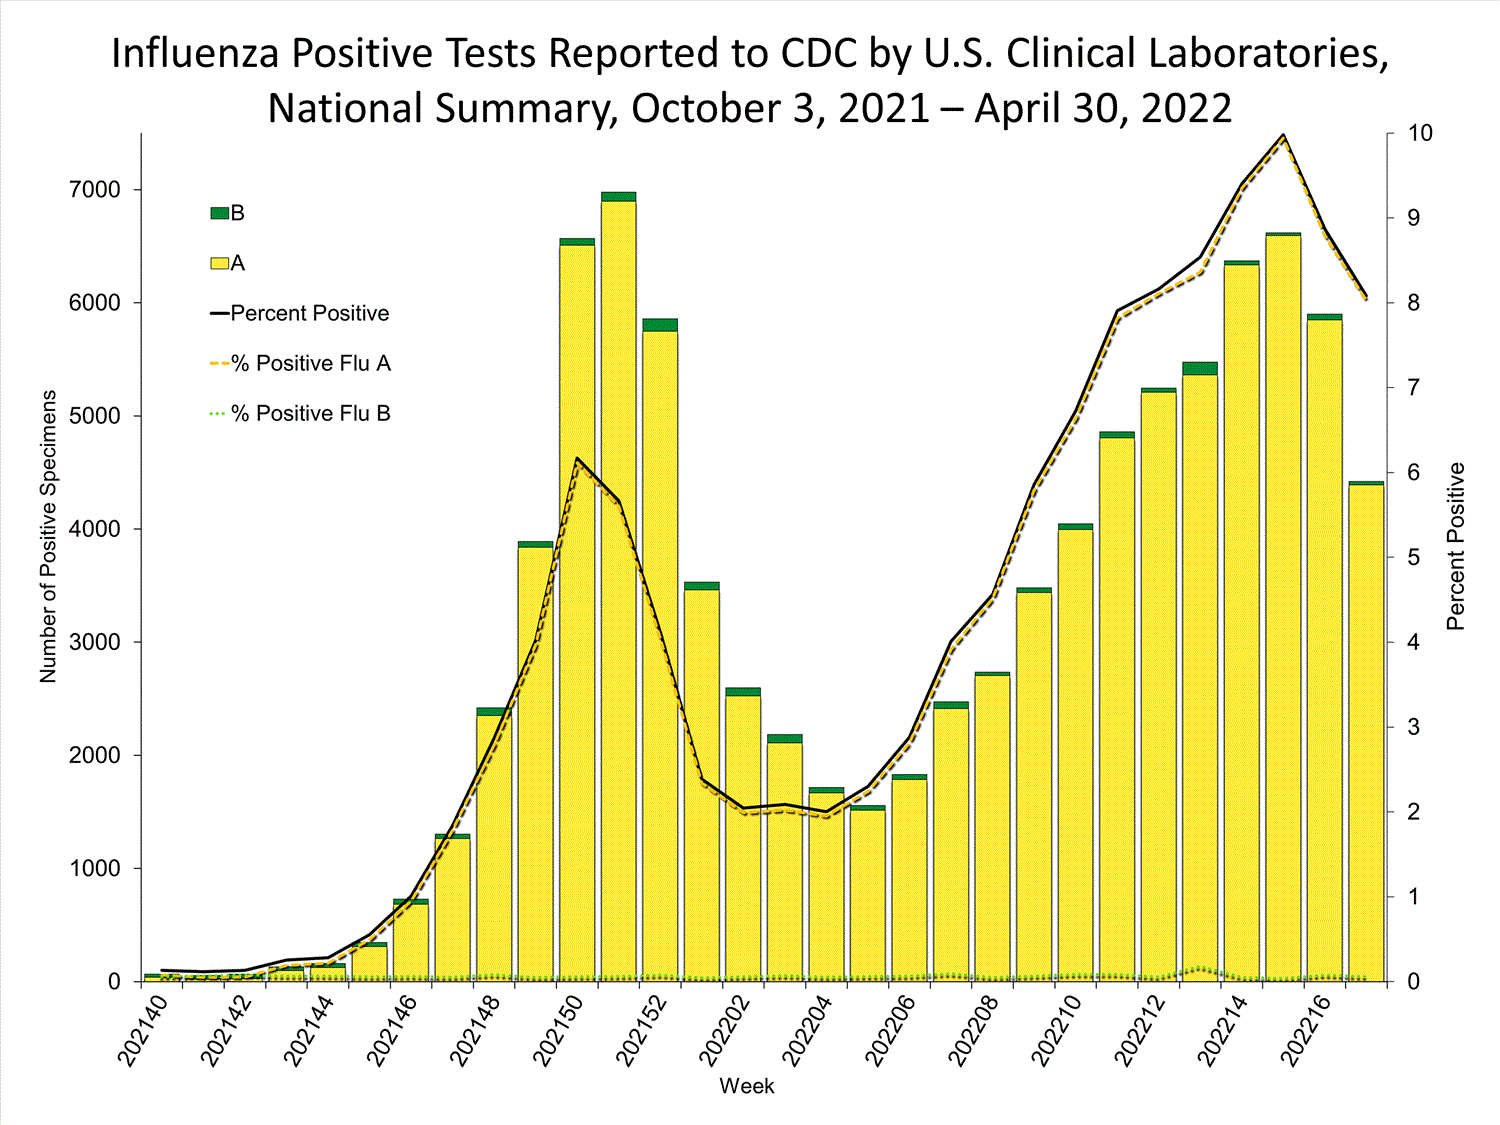
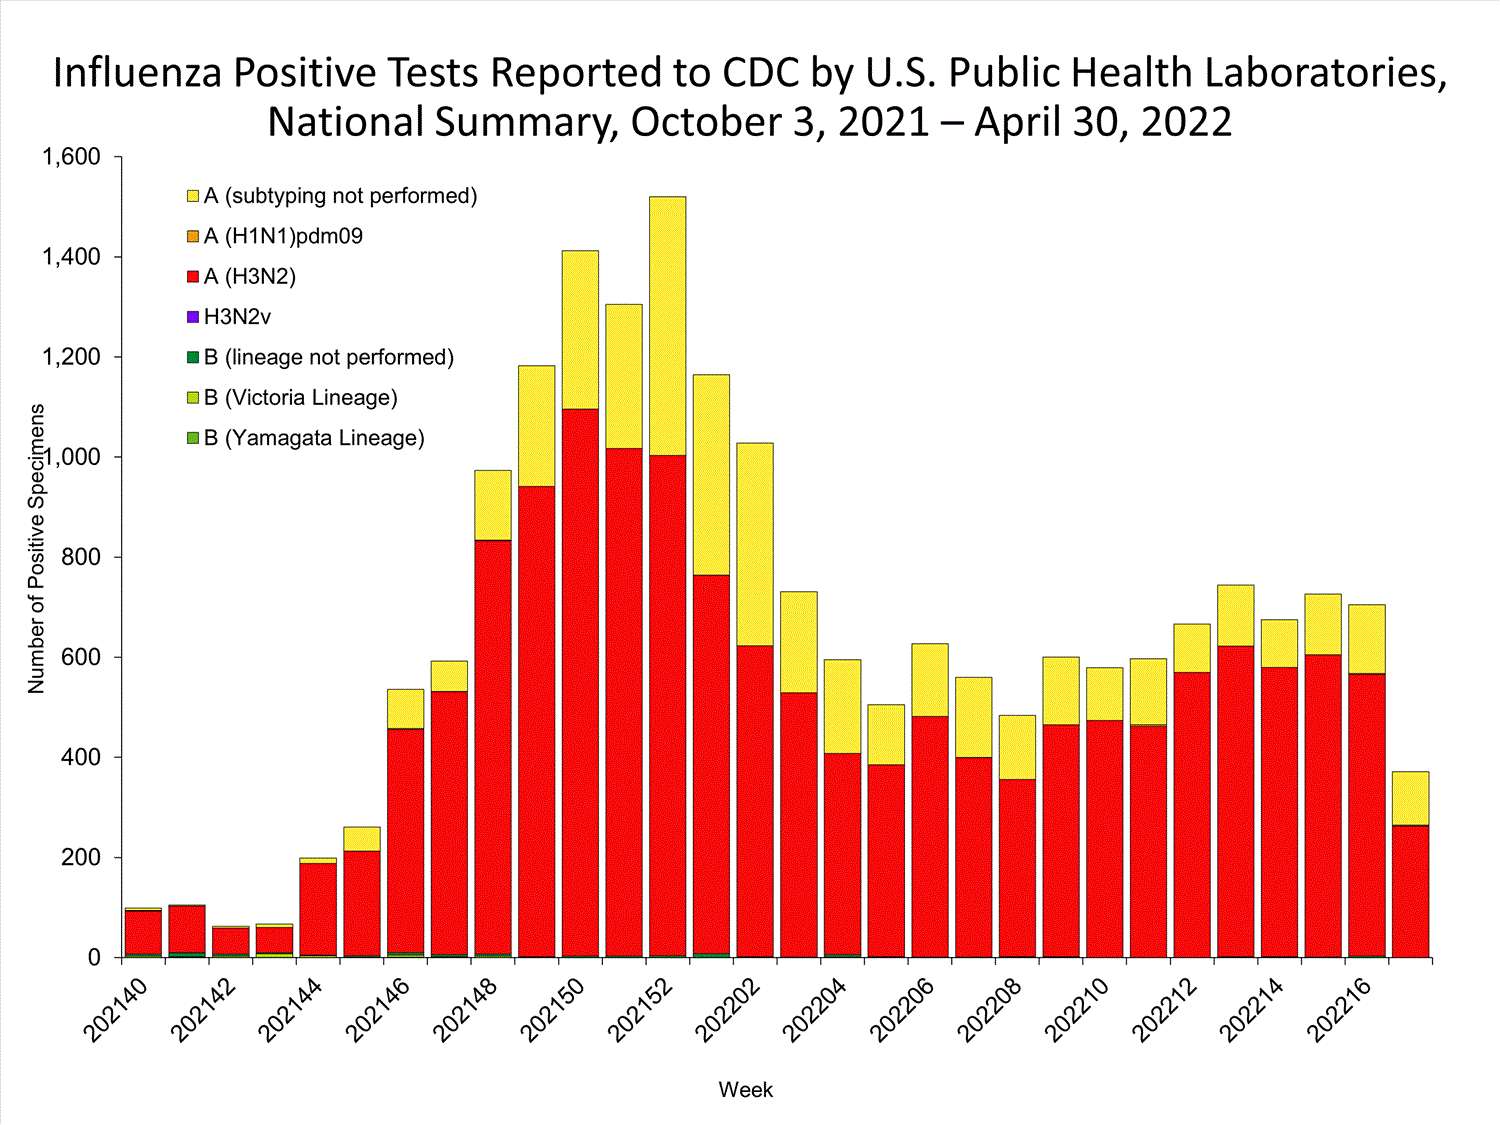
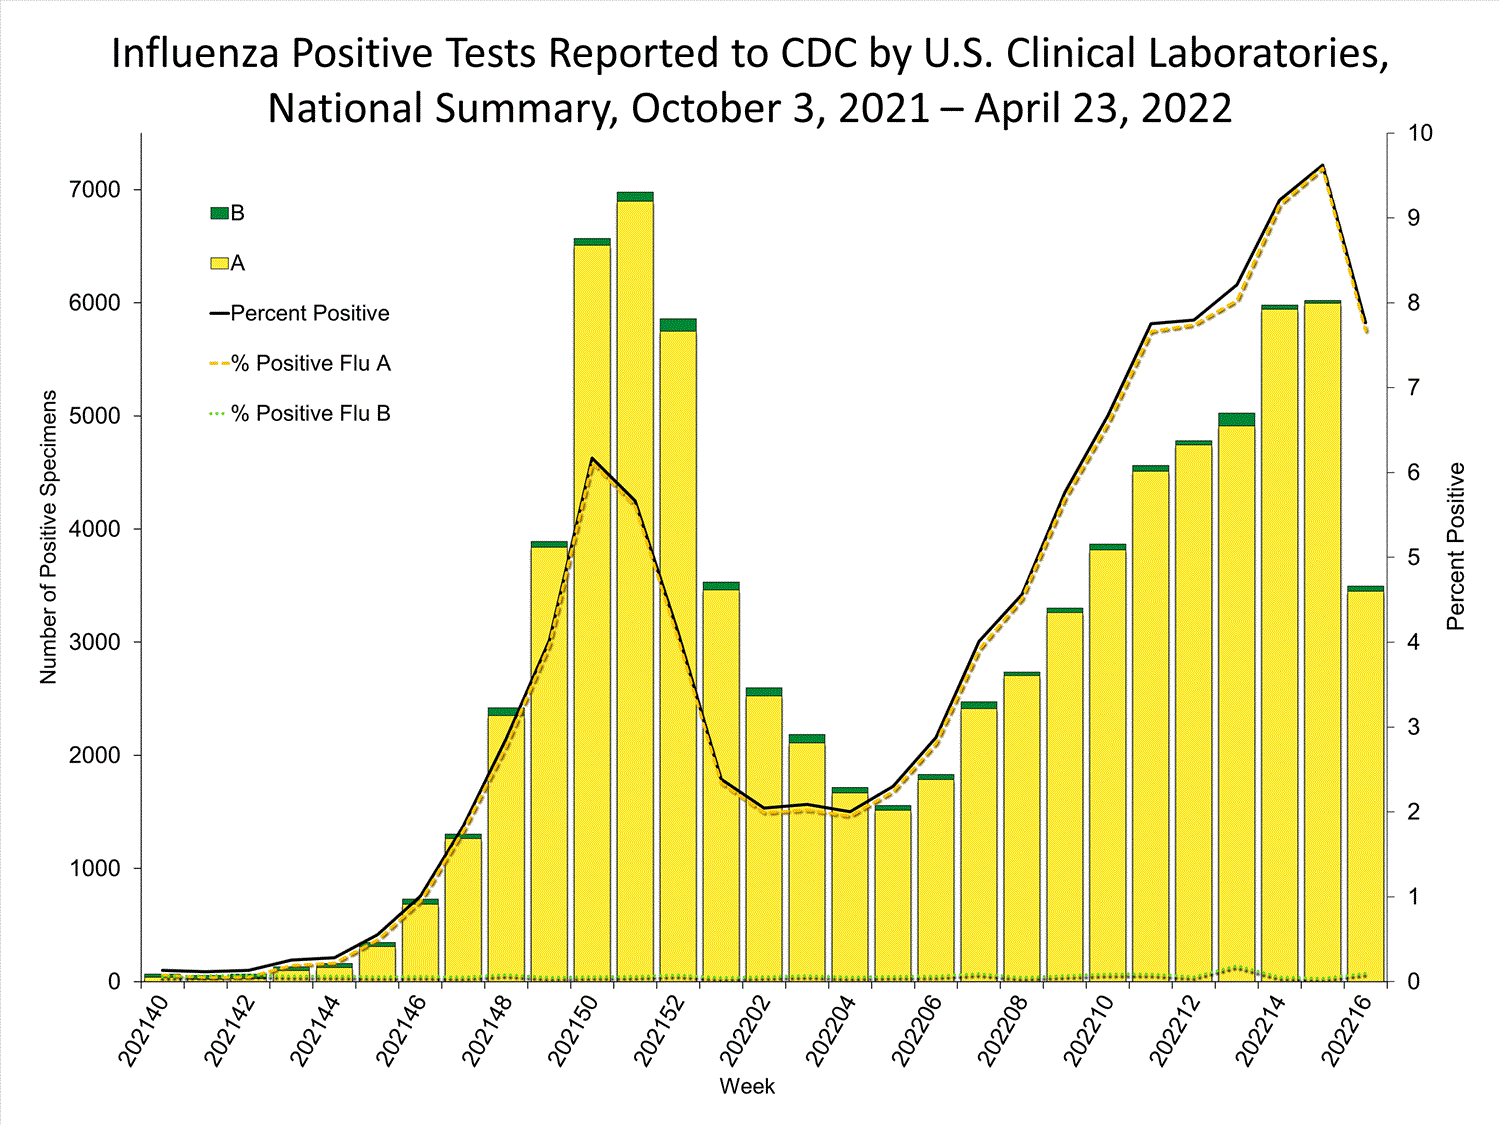
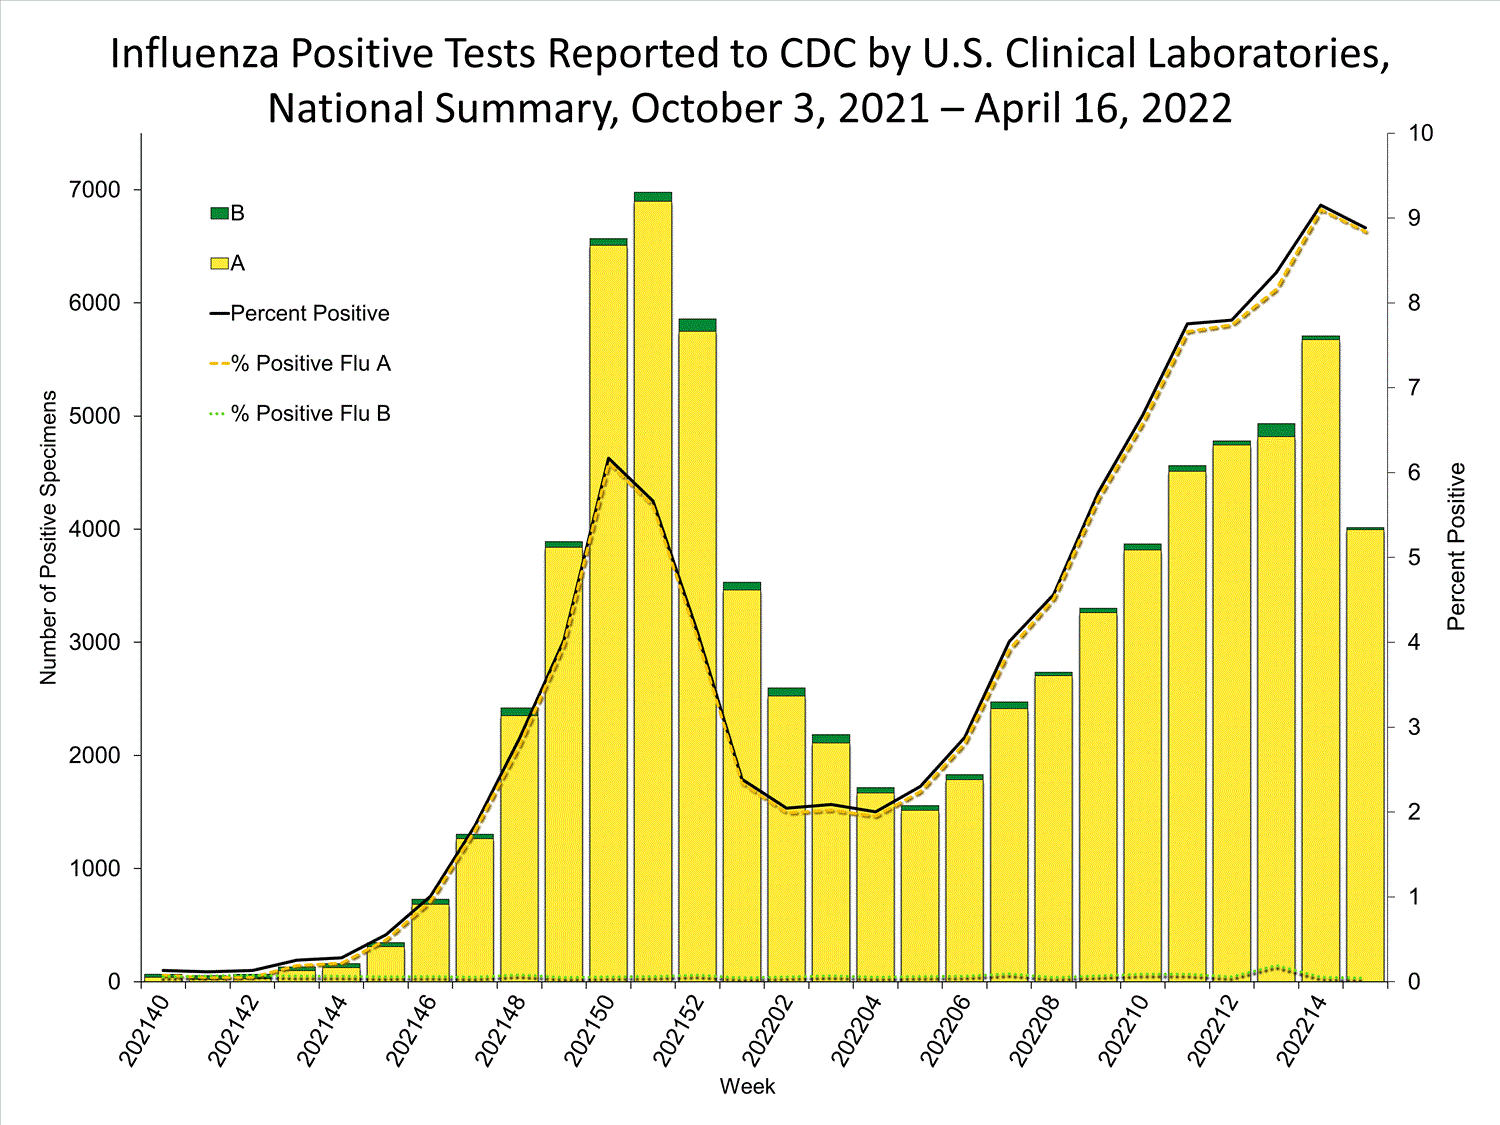
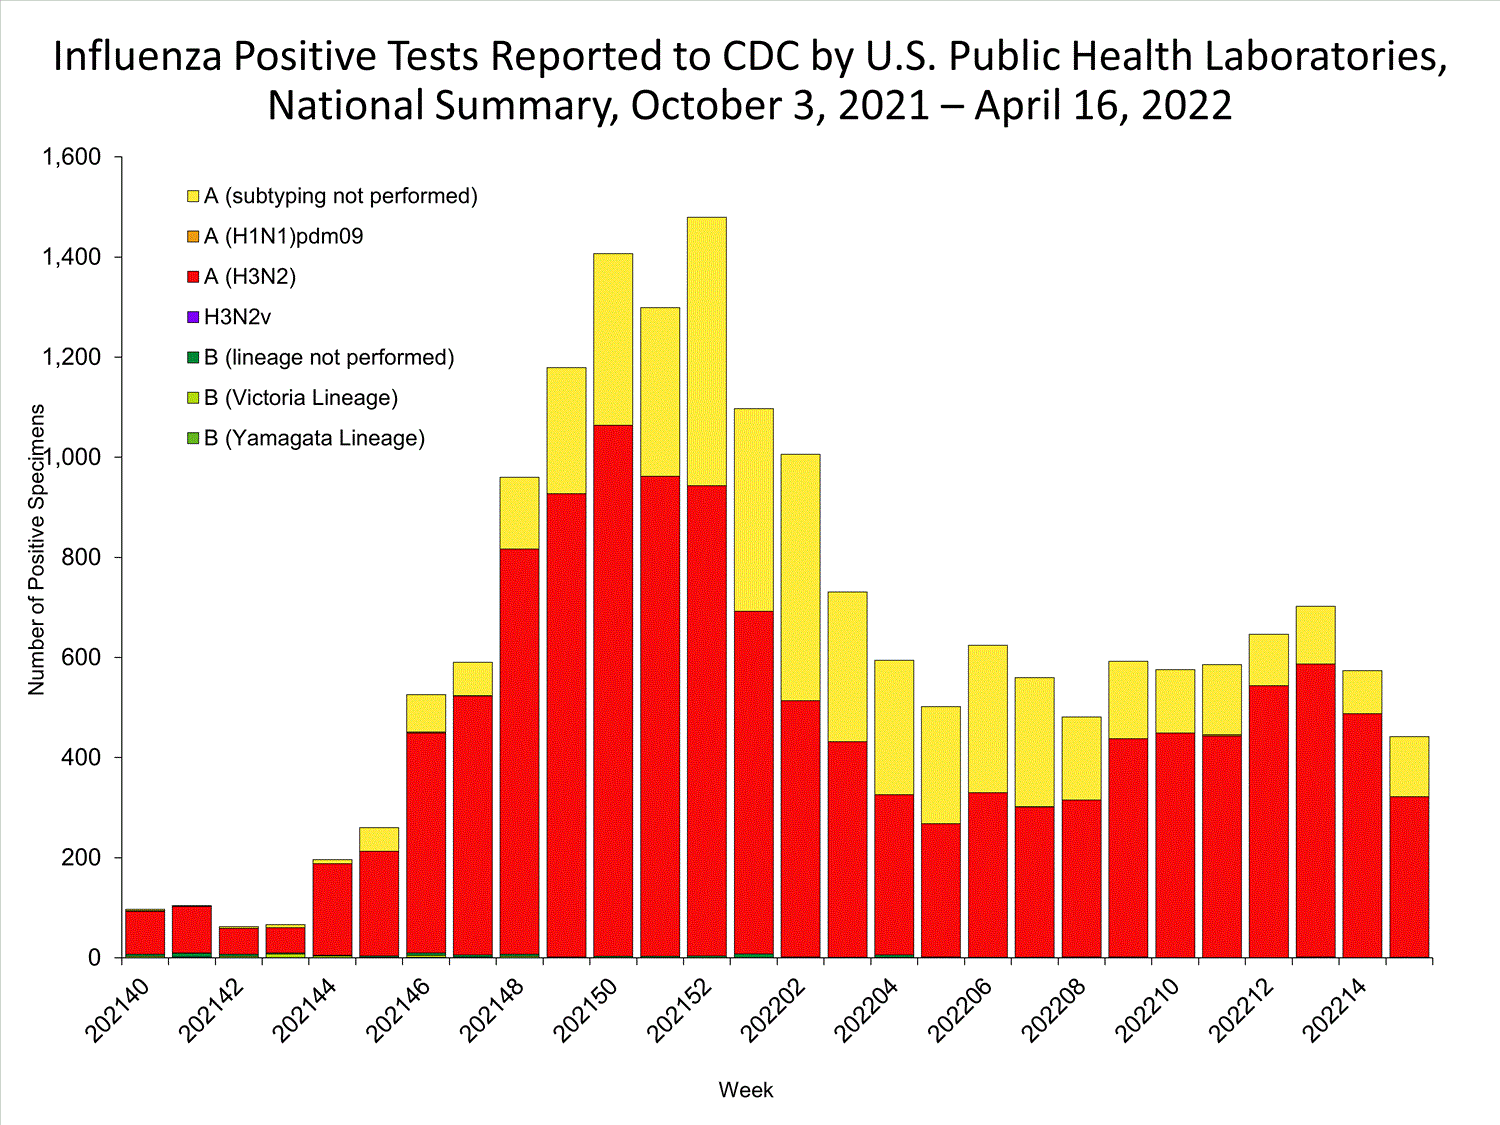
The percentage of specimens testing positive for influenza in clinical laboratories was lower than the previous week nationally and in all regions. Influenza A(H3N2) viruses have been the most frequently detected influenza viruses this season. Of the 13,275 influenza positives reported this season by the public health labs and also tested for SARS-CoV-2, 563 (4.2%) were also positive for SARS-CoV-2. For regional and state level data and age group distribution, please visit FluView Interactive. Viruses known to be associated with recent live attenuated influenza vaccine (LAIV) receipt or found upon further testing to be a vaccine virus are not included as they are not circulating influenza viruses.
Clinical Laboratories
The results of tests performed by clinical laboratories nationwide are summarized below. Data from clinical laboratories (the percentage of specimens tested that are positive for influenza) are used to monitor whether influenza activity is increasing or decreasing.
| No. of specimens tested | 55,572 | 2,746,400 |
| No. of positive specimens (%) | 1,877 (3.4%) | 122,502 (4.5%) |
| Positive specimens by type | ||
| Influenza A | 1,854 (98.8%) | 120,734 (98.6%) |
| Influenza B | 23 (1.2%) | 1,768 (1.4%) |
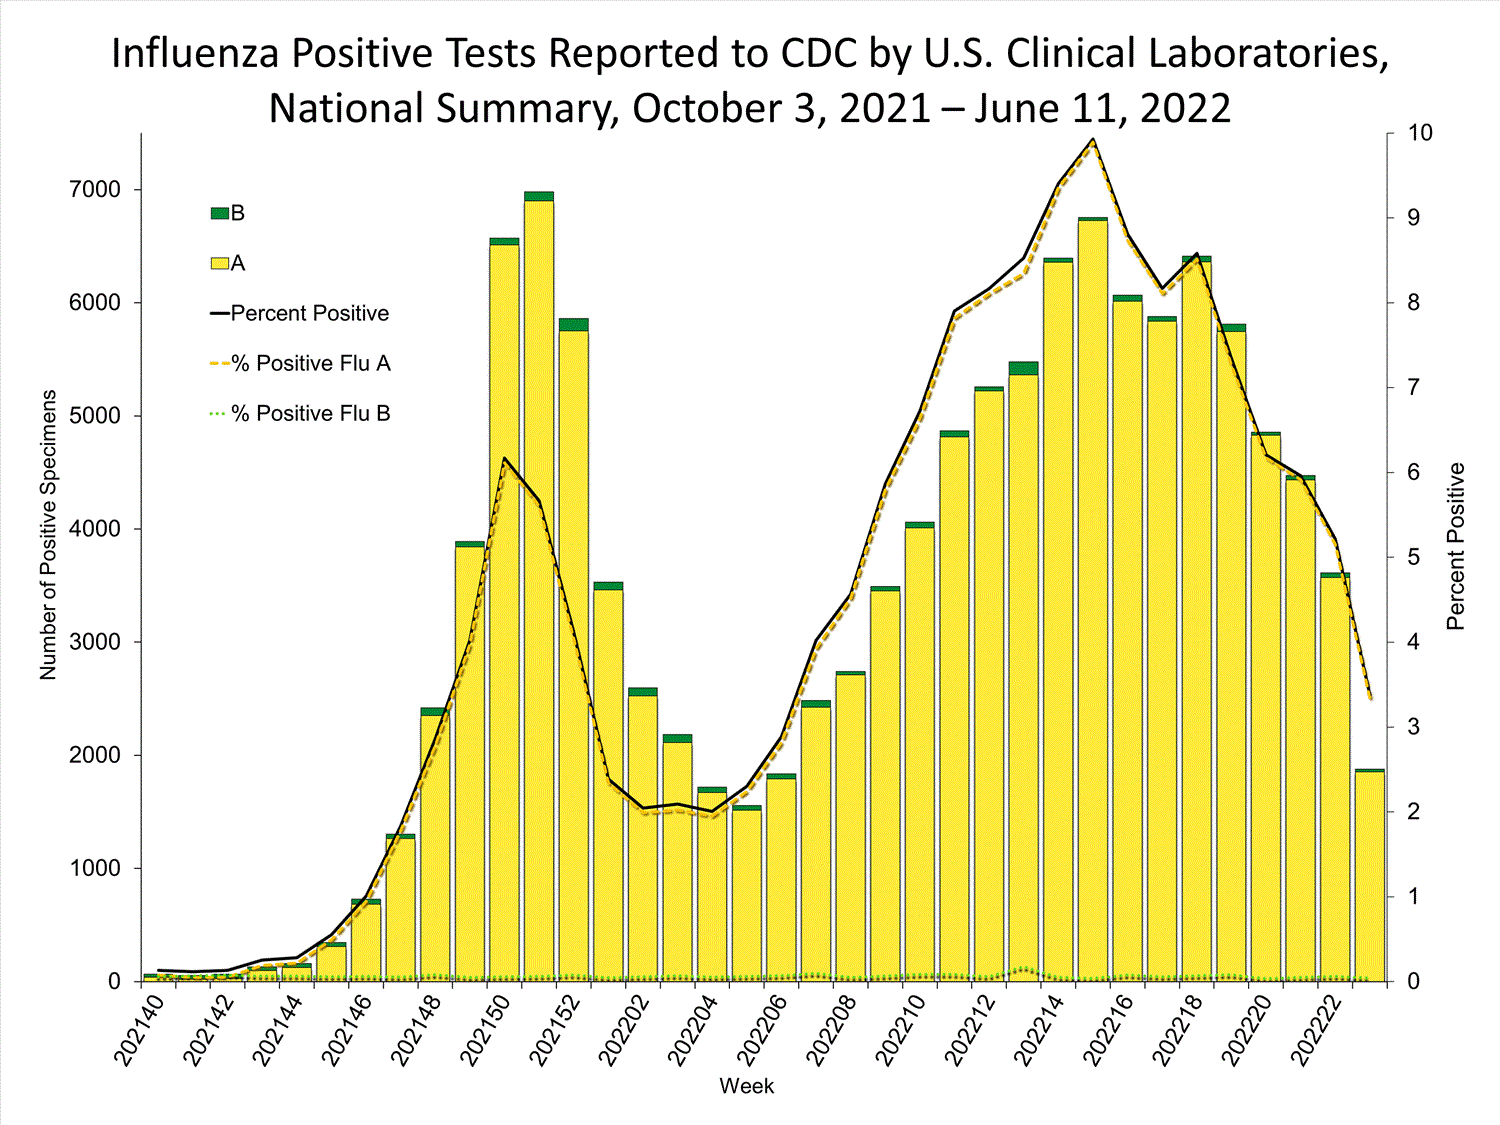
View Chart Data | View Full Screen Public Health Laboratories
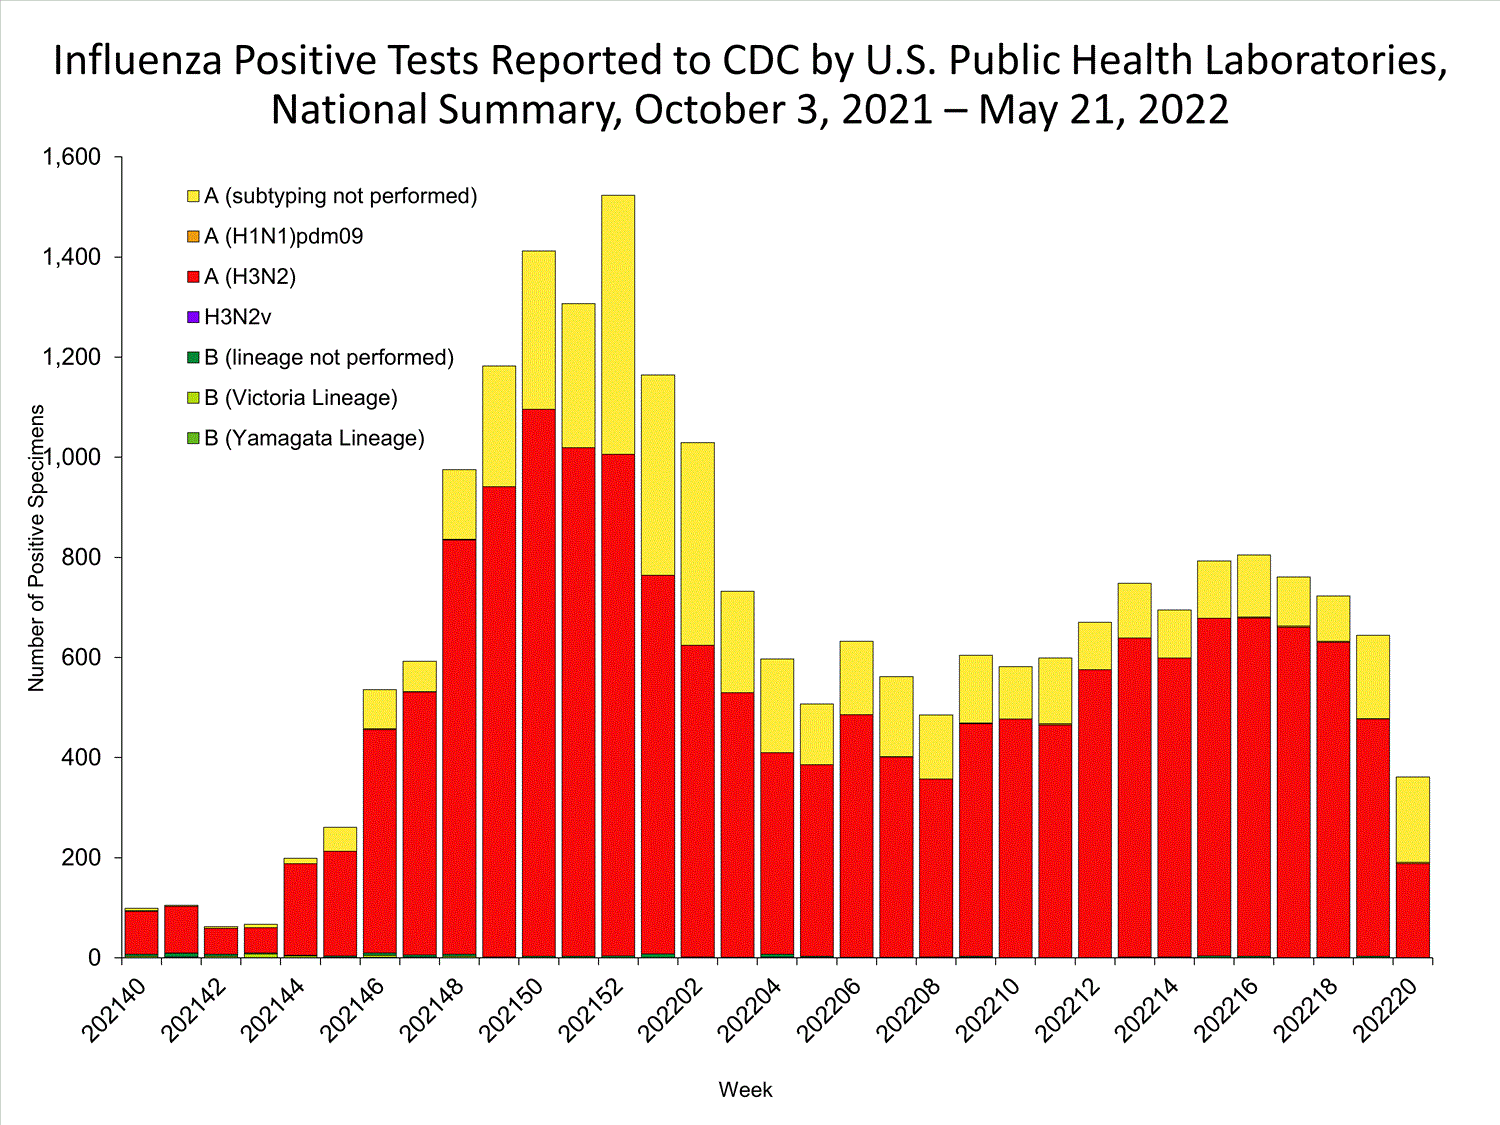
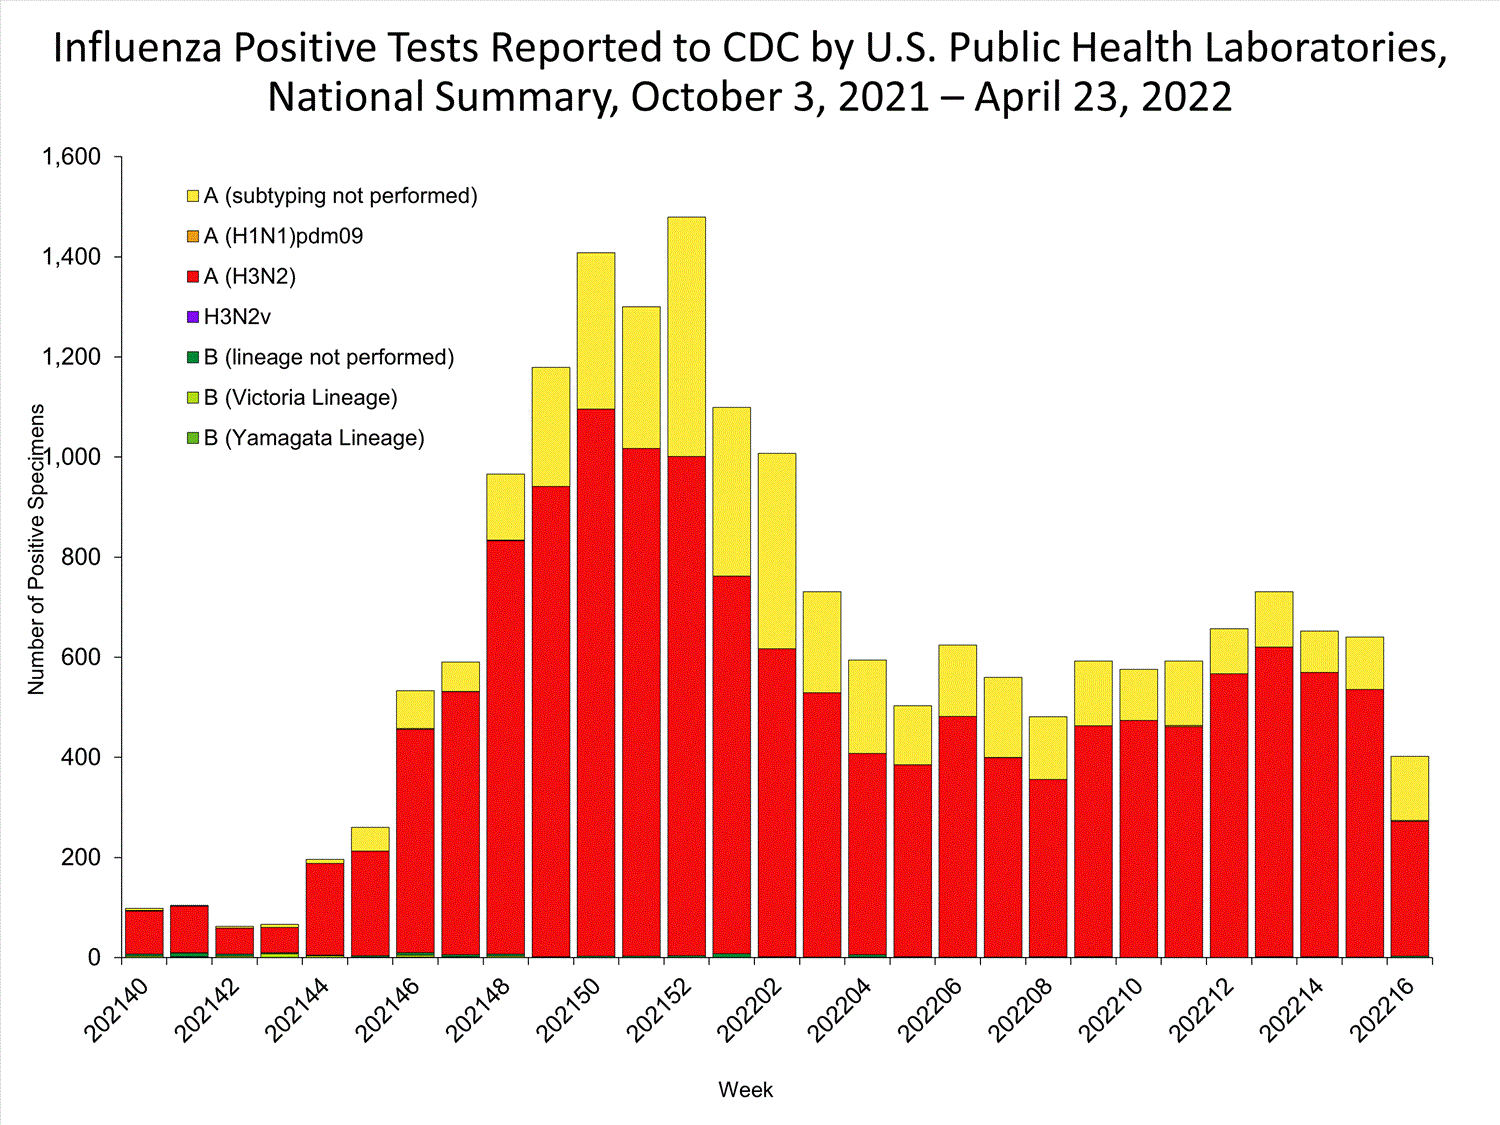
The results of tests performed by public health laboratories nationwide are summarized below. Data from public health laboratories are used to monitor the proportion of circulating viruses that belong to each influenza subtype/lineage.
| No. of specimens tested | 14,270 | 873,589 |
| No. of positive specimens | 280 | 24,098 |
| Positive specimens by type/subtype | ||
| Influenza A | 278 (99.3%) | 23,972 (99.5%) |
| (H1N1)pdm09 | 0 | 25 (0.1%) |
| H3N2 | 176 (100%) | 18,663 (99.9%) |
| H3N2v | 0 | 1 (<0.1%) |
| Subtyping not performed | 102 | 5,283 |
| Influenza B | 2 (0.7%) | 126 (0.5%) |
| Yamagata lineage | 0 | 1 (2.4%) |
| Victoria lineage | 0 | 40 (97.6%) |
| Lineage not performed | 2 | 85 |
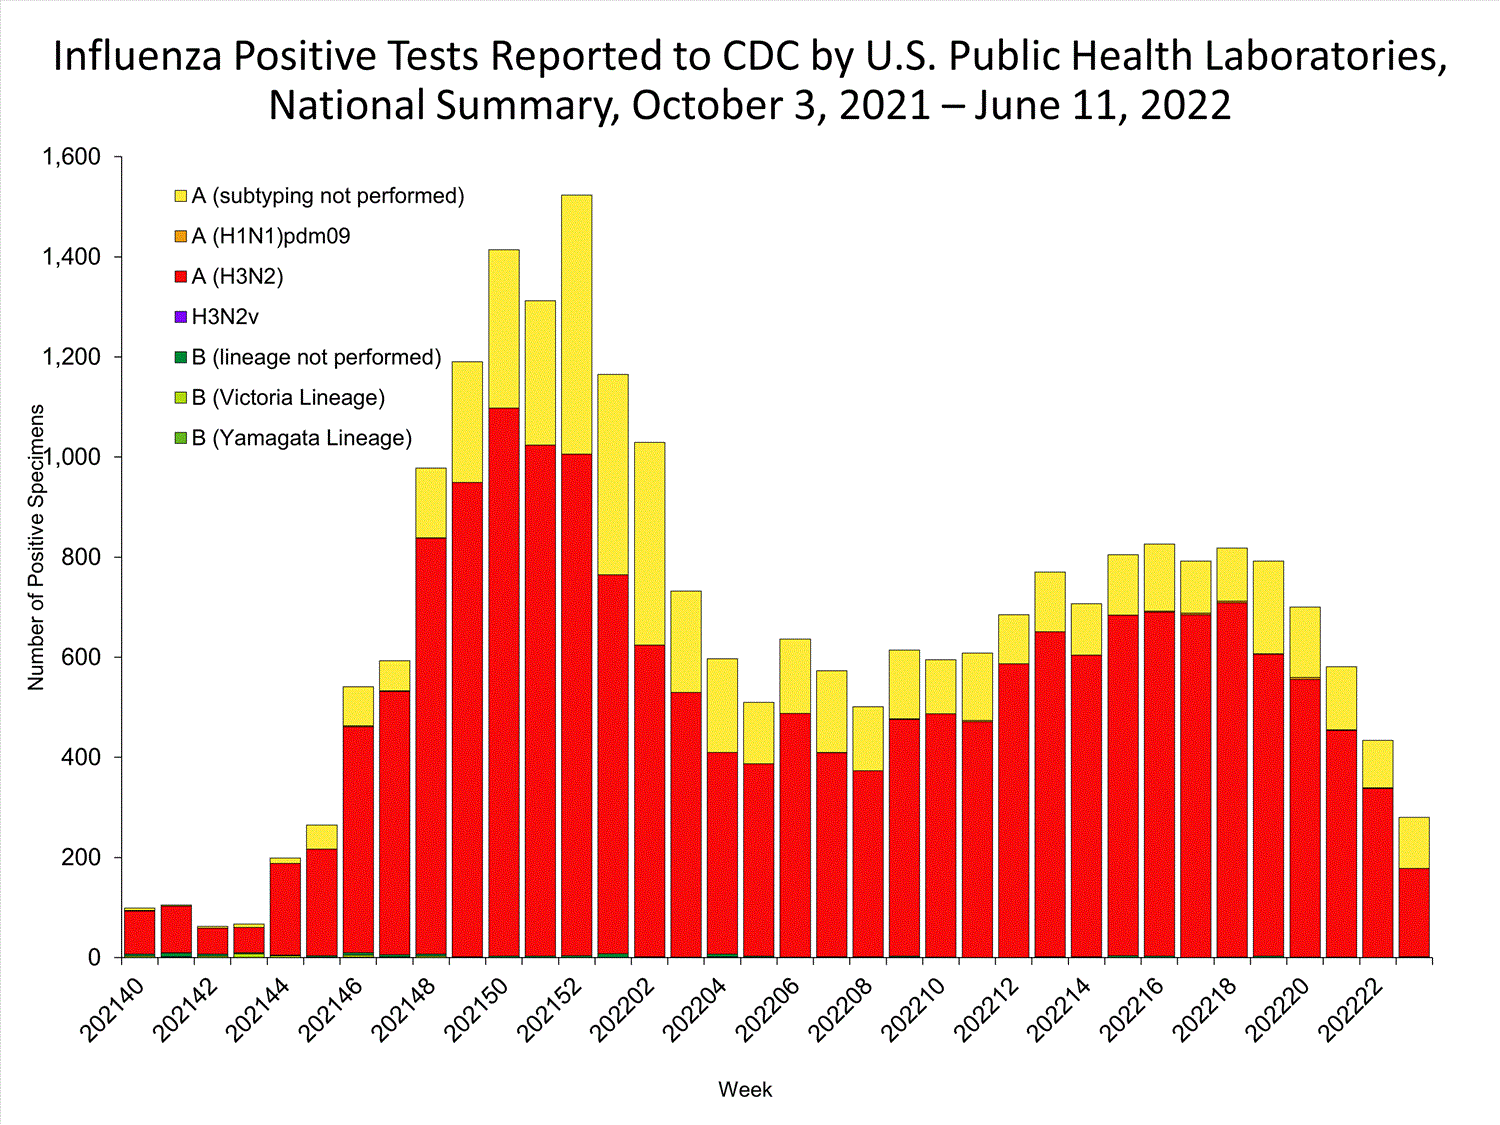
View Chart Data | View Full Screen
Additional virologic surveillance information for current and past seasons:
Surveillance Methods | FluView Interactive: National, Regional, and State Data or Age Data
Influenza Virus Characterization
CDC performs genetic and antigenic characterization of U.S. viruses submitted from state and local public health laboratories using the Right Size Roadmap submission guidance. These data are used to compare how similar the currently circulating influenza viruses are to the reference viruses representing viruses contained in the current influenza vaccines. The data are also used to monitor evolutionary changes that continually occur in influenza viruses circulating in humans. CDC also tests susceptibility of circulating influenza viruses to antiviral medications including the neuraminidase inhibitors (oseltamivir, zanamivir, and peramivir) and the PA endonuclease inhibitor baloxavir.
CDC has genetically characterized 1,600 influenza viruses collected since October 3, 2021. H3N2 viruses identified so far this season are genetically closely related to the vaccine virus, but there are some antigenic differences that have developed as H3N2 viruses have continued to evolve.
| A/H1 | 9 | ||||
| 6B.1A | 9 (100%) | 5a.1 | 7 (77.8%) | ||
| 5a.2 | 2 (22.2%) | ||||
| A/H3 | 1,567 | ||||
| 3C.2a1b | 1,567 (100%) | 1a | 3 (0.2%) | ||
| 1b | 1 (0.1%) | ||||
| 2a | 0 | ||||
| 2a.1 | 0 | ||||
| 2a.2 | 1,563 (99.7%) | ||||
| 3C.3a | 0 | 3a | 0 | ||
| B/Victoria | 24 | ||||
| V1A | 24 (100%) | V1A | 0 | ||
| V1A.1 | 0 | ||||
| V1A.3 | 9 (37.5%) | ||||
| V1A.3a | 0 | ||||
| V1A.3a.1 | 0 | ||||
| V1A.3a.2 | 15 (62.5%) | ||||
| B/Yamagata | 0 | ||||
| Y3 | 0 |
Influenza A Viruses
- A (H1N1)pdm09: Three A(H1N1)pdm09 viruses were antigenically characterized by HI, and 2 (67%) were well recognized (reacting at titers that were within 4-fold of the homologous virus titer) by ferret antisera to cell-grown A/Wisconsin/588/2019-like reference viruses representing the A(H1N1)pdm09 component for the cell- and recombinant-based influenza vaccines, and 2 (67%) were well recognized by ferret antisera to egg-grown A/Victoria/2570/2019-like reference viruses representing the A(H1N1)pdm09 component for the egg-based influenza vaccines.
- A (H3N2): A subset of 117 A(H3N2) viruses were antigenically characterized by HINT, and 4 (3%) were well recognized (reacting at titers that were within 8-fold of the homologous virus titer) by ferret antisera to cell-grown A/Cambodia/E0826360/2020-like reference viruses representing the A(H3N2) component for the cell- and recombinant-based influenza vaccines, and 21 (18%) were well recognized by ferret antisera to egg-grown A/Cambodia/E0826360/2020-like reference viruses representing the A(H3N2) component for egg-based influenza vaccines.
Influenza B Viruses
- B/Victoria: Fifteen B/Victoria lineage viruses were antigenically characterized by HI, and 11 (73%) were well recognized (reacting at titers that were within 4-fold of the homologous virus titer) by ferret antisera to cell-grown B/Washington/02/2019-like reference viruses representing the B/Victoria component for the cell- and recombinant-based influenza vaccines, and 11 (73%) were well recognized by ferret antisera to egg-grown B/Washington/02/2019-like reference viruses representing the B/Victoria component for egg-based influenza vaccines.
- B/Yamagata: No influenza B/Yamagata-lineage viruses were available for antigenic characterization.
Assessment of Virus Susceptibility to Antiviral Medications
CDC assesses susceptibility of influenza viruses to antiviral medications including the neuraminidase inhibitors (oseltamivir, zanamivir, and peramivir) and the PA endonuclease inhibitor baloxavir using next generation sequence analysis supplemented by laboratory assays. Information about antiviral susceptibility test methods can be found at U.S. Influenza Surveillance: Purpose and Methods | CDC.
Viruses collected in the United States since October 3, 2021, were tested for antiviral susceptibility as follows:
| Neuraminidase Inhibitors |
|||||||
| Oseltamivir | Viruses Tested |
1,615 | 9 | 1,582 | 24 | 0 | |
| Reduced Inhibition |
(0.0%) | (0.0%) | (0.0%) | (0.0%) | (0.0%) | ||
| Highly Reduced Inhibition |
1 (0.1%) | 1 (11.1%) | (0.0%) | (0.0%) | (0.0%) | ||
| Peramivir | Viruses Tested |
1,615 | 9 | 1,582 | 24 | 0 | |
| Reduced Inhibition |
(0.0%) | (0.0%) | (0.0%) | (0.0%) | (0.0%) | ||
| Highly Reduced Inhibition |
1 (0.1%) | 1 (11.1%) | (0.0%) | (0.0%) | (0.0%) | ||
| Zanamivir | Viruses Tested |
1,615 | 9 | 1,582 | 24 | 0 | |
| Reduced Inhibition |
(0.0%) | (0.0%) | (0.0%) | (0.0%) | (0.0%) | ||
| Highly Reduced Inhibition |
(0.0%) | (0.0%) | (0.0%) | (0.0%) | (0.0%) | ||
| PA Cap-Dependent Endonuclease Inhibitor | Baloxavir | Viruses Tested |
1,613 | 9 | 1,580 | 24 | 0 |
| Reduced Susceptibility |
1 (0.1%) | (0.0%) | 1 (0.1%) | (0.0%) | (0.0%) |
One A(H1N1)pdm09 virus had a NA-H275Y amino acid substitution, a marker of oseltamivir resistance.
One A(H3N2) virus had a PA-I38M amino acid substitution previously associated with reduced baloxavir susceptibility and showed ~8-fold reduced susceptibility to baloxavir in vitro.
High levels of resistance to the adamantanes (amantadine and rimantadine) persist among influenza A(H1N1)pdm09 and influenza A(H3N2) viruses (the adamantanes are not effective against influenza B viruses). Therefore, use of these antivirals for treatment and prevention of influenza A virus infection is not recommended, and data from adamantane resistance testing are not presented.
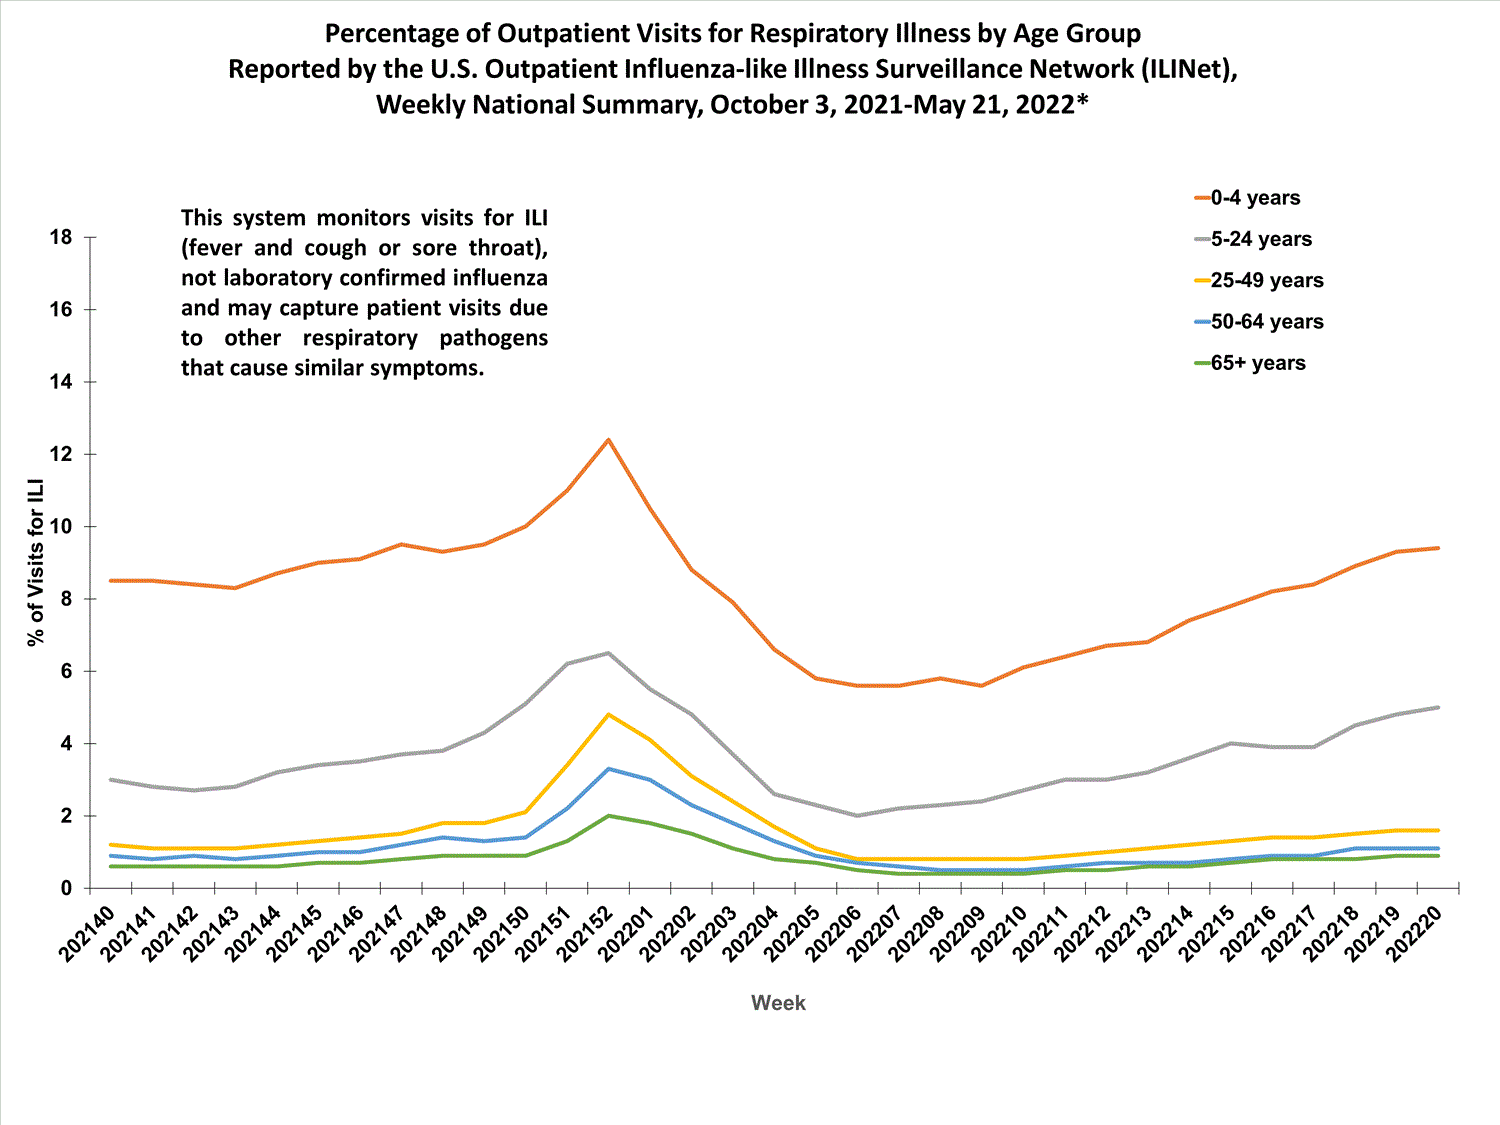
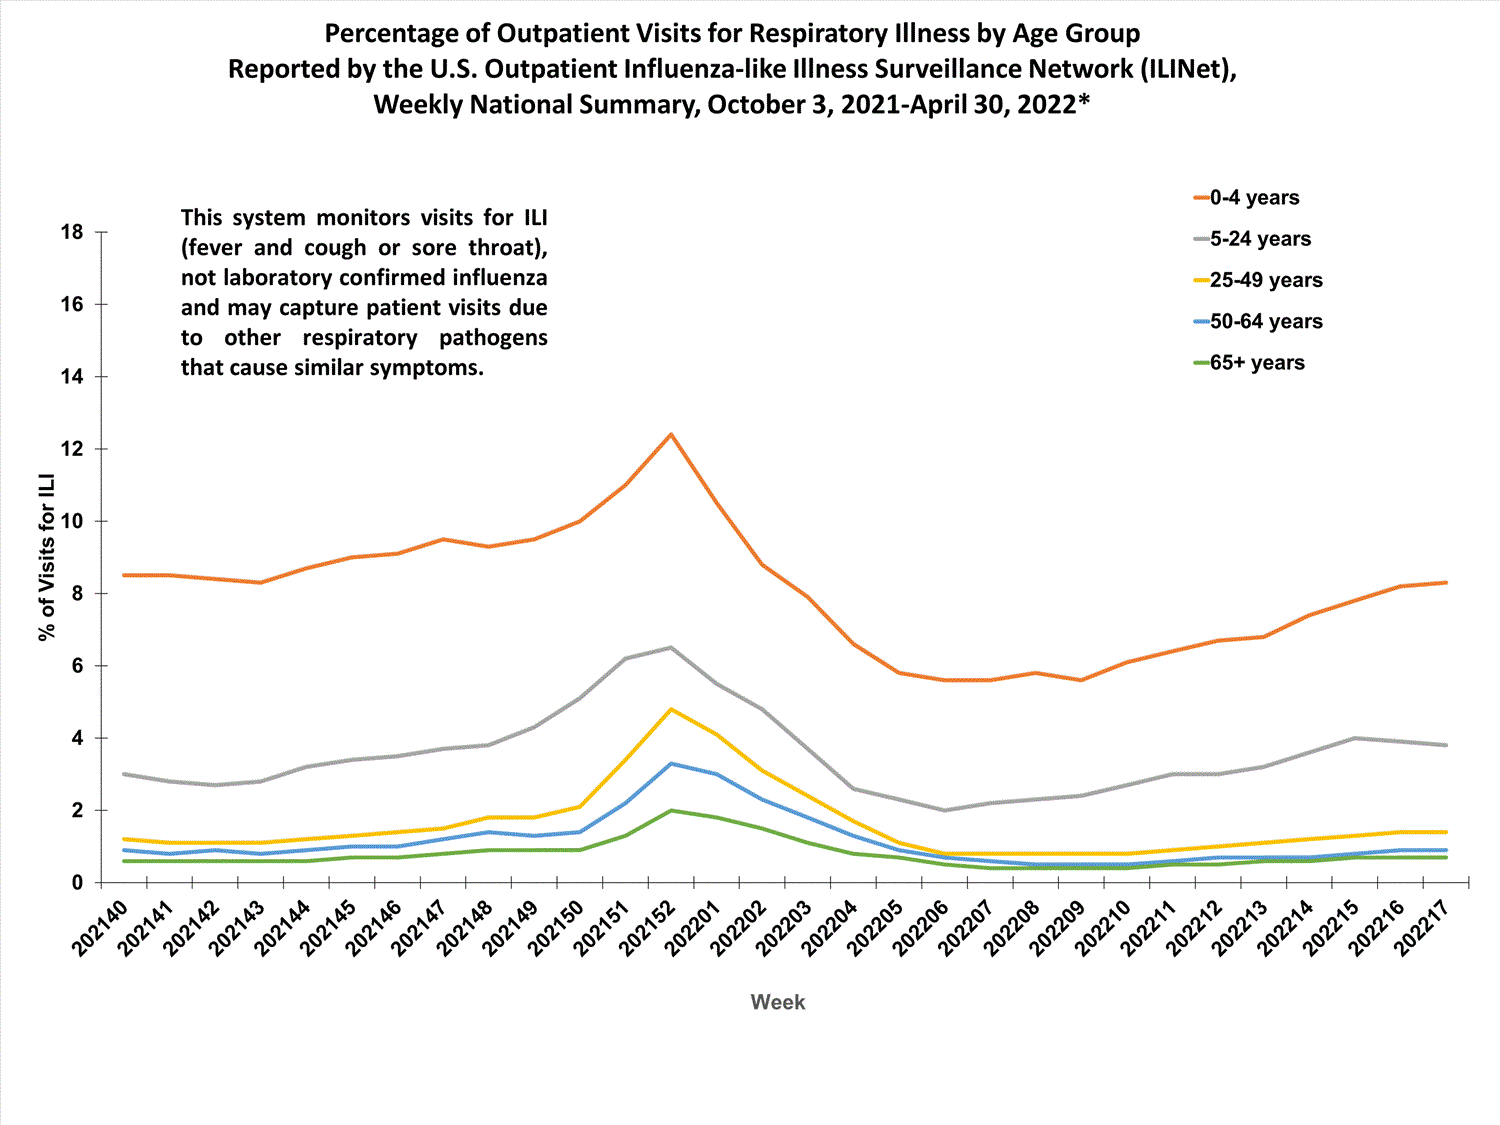
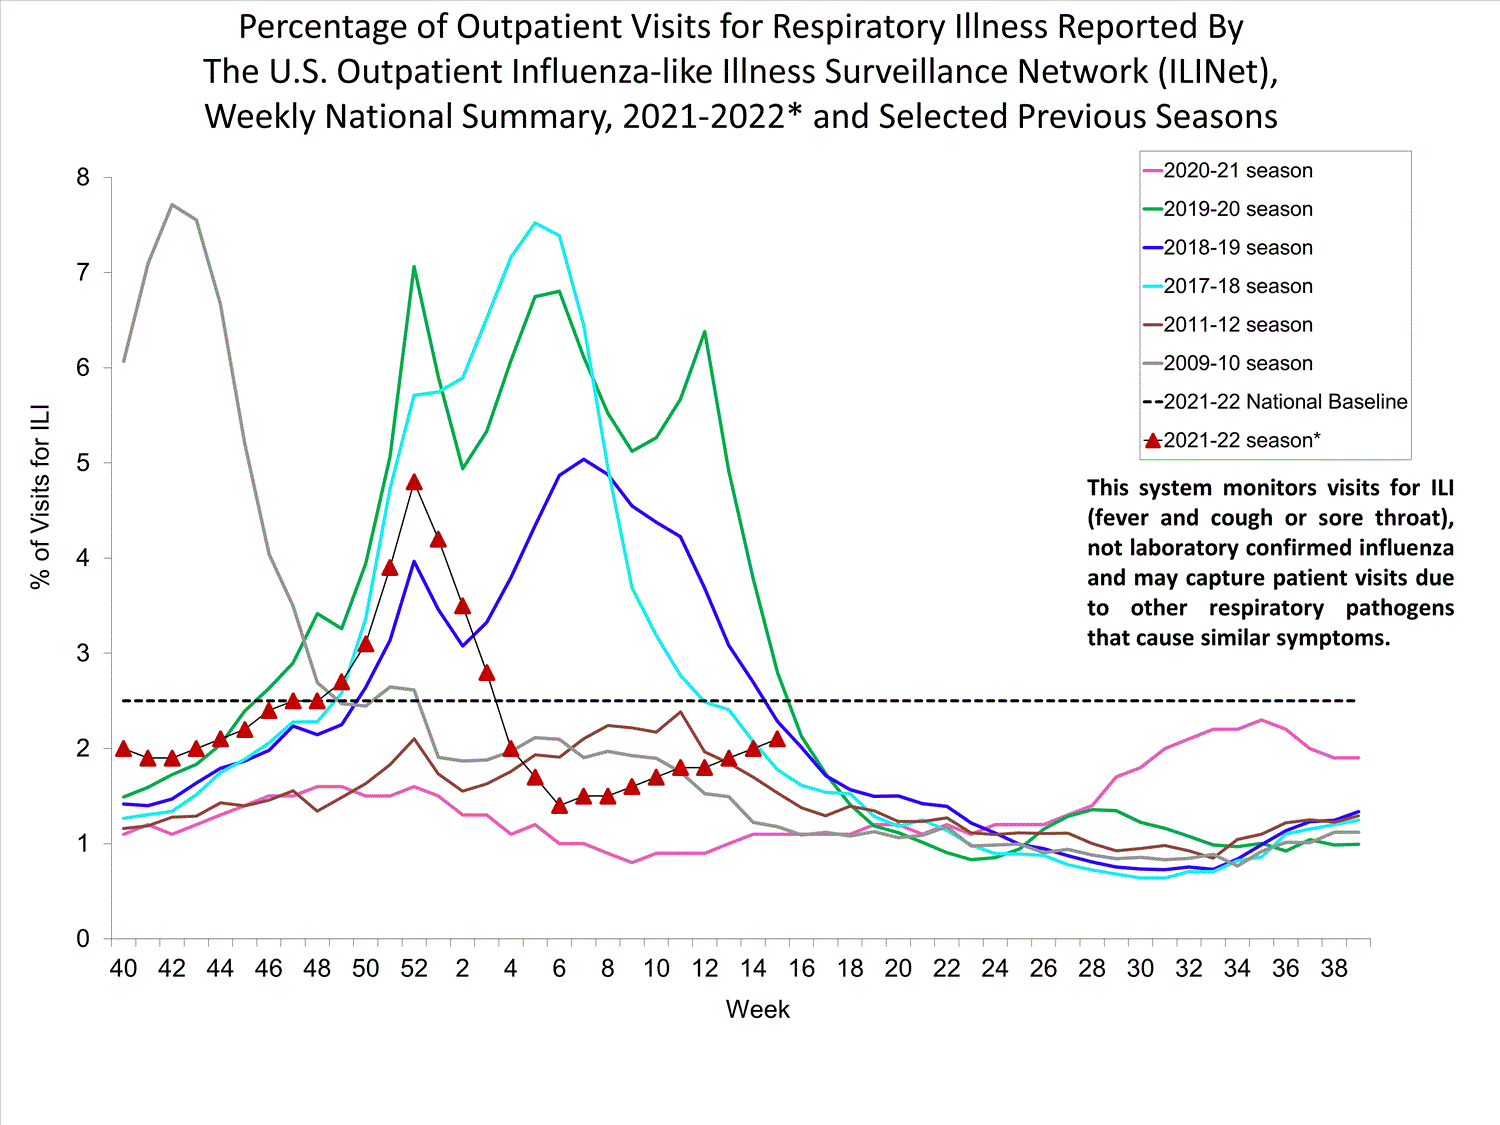
Outpatient Respiratory Illness Surveillance
The U.S. Outpatient Influenza-like Illness Surveillance Network (ILINet) monitors outpatient visits for influenza-like illness [ILI (fever plus cough or sore throat)], not laboratory-confirmed influenza, and will therefore capture respiratory illness visits due to infection with any pathogen that can present with similar symptoms, including influenza, SARS-CoV-2, and RSV. Due to the COVID-19 pandemic, health care-seeking behaviors have changed, and people may be accessing the health care system in alternative settings not captured as a part of ILINet or at a different point in their illness than they might have before the pandemic. Therefore, it is important to evaluate syndromic surveillance data, including that from ILINet, in the context of other sources of surveillance data to obtain a complete and accurate picture of influenza, SARS-CoV-2, and other respiratory virus activity. CDC is tracking the COVID-19 pandemic in a weekly publication called COVID Data Tracker Weekly Review. Information about other respiratory virus activity can be found on CDC’s National Respiratory and Enteric Virus Surveillance System (NREVSS) website.
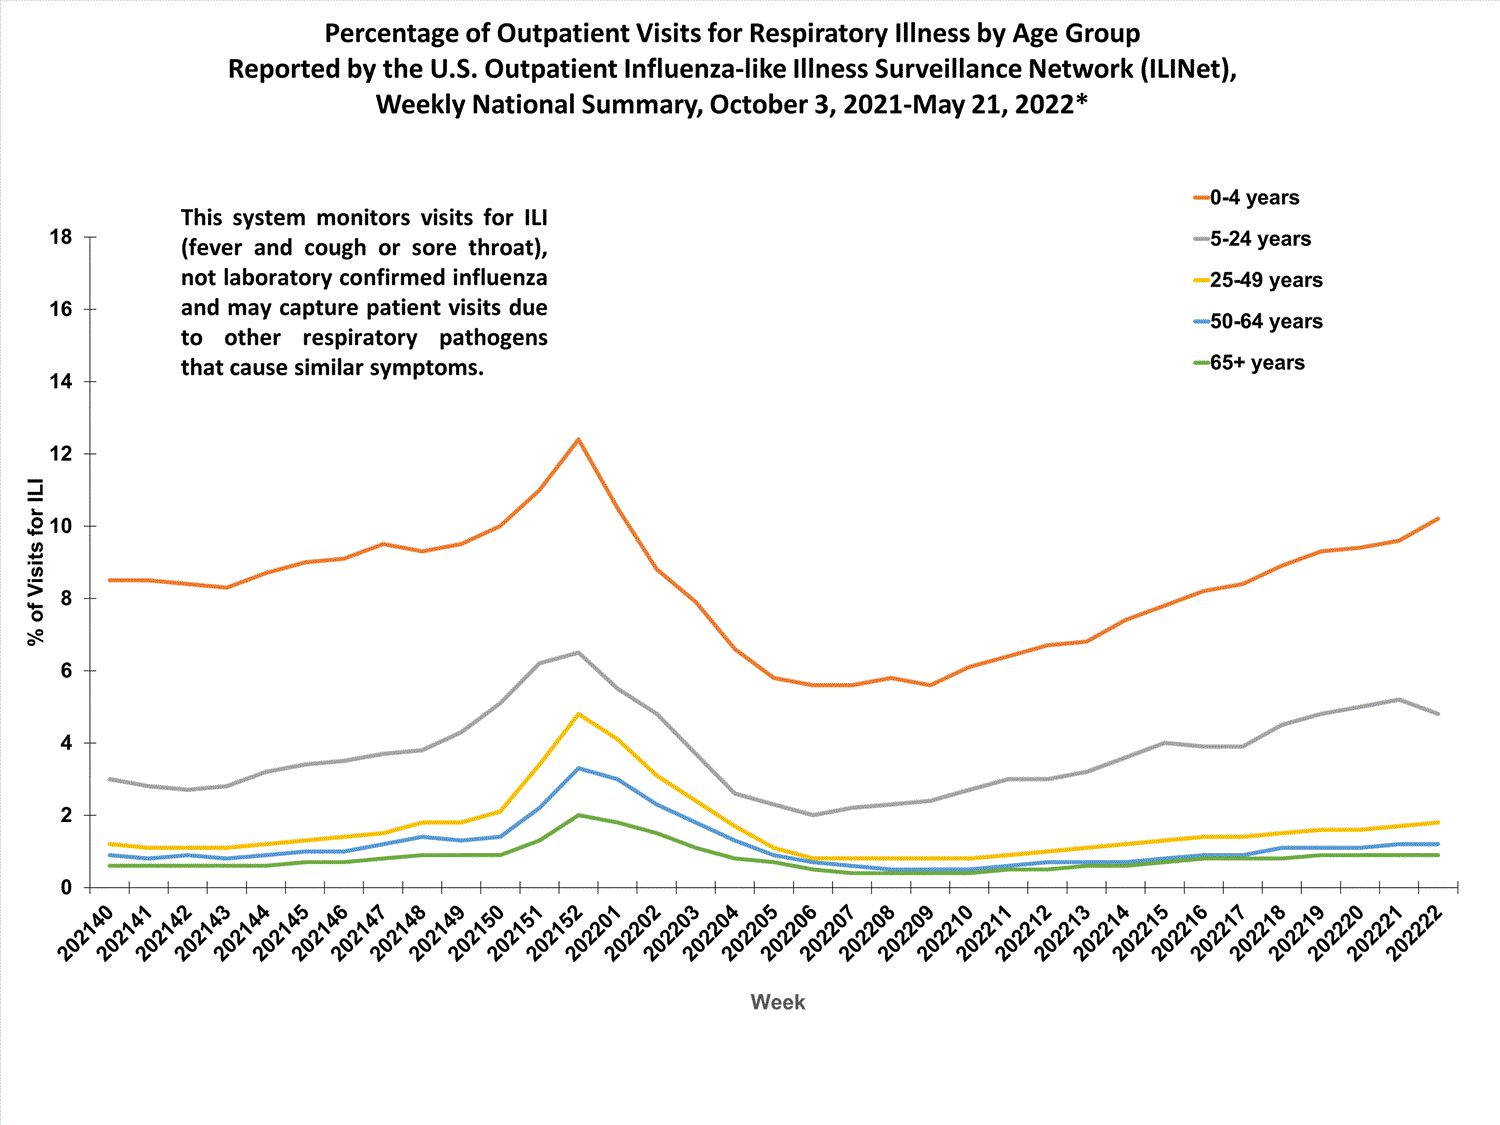
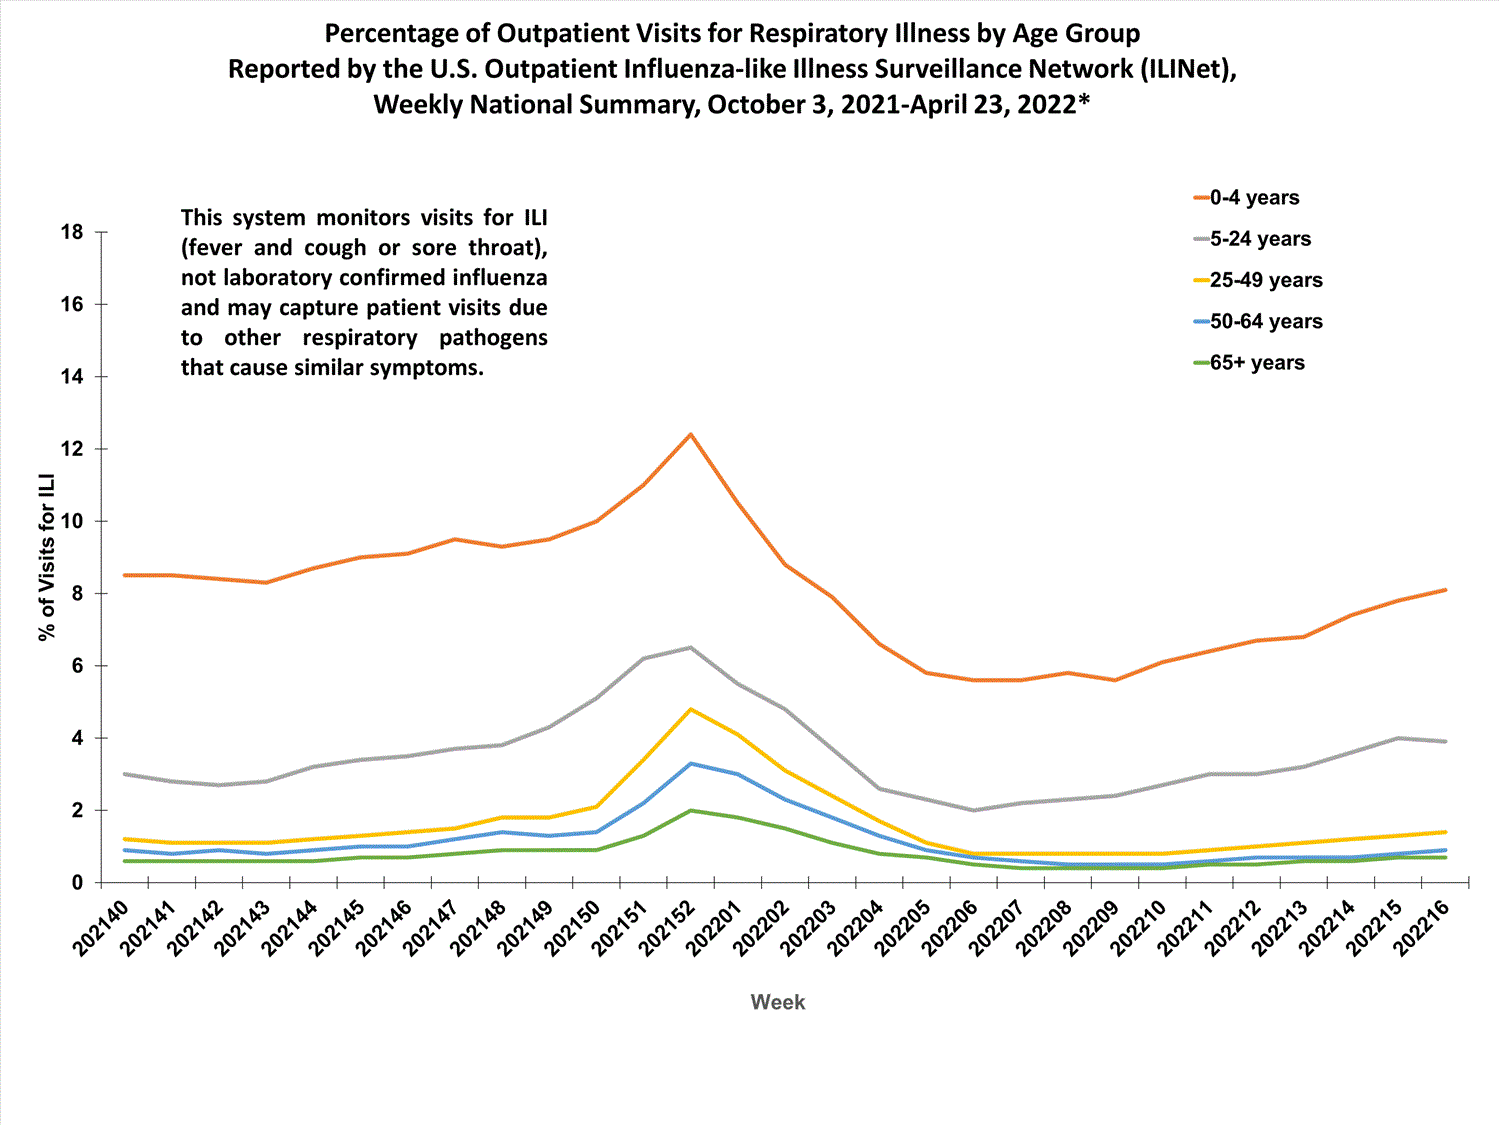
Outpatient Respiratory Illness Visits
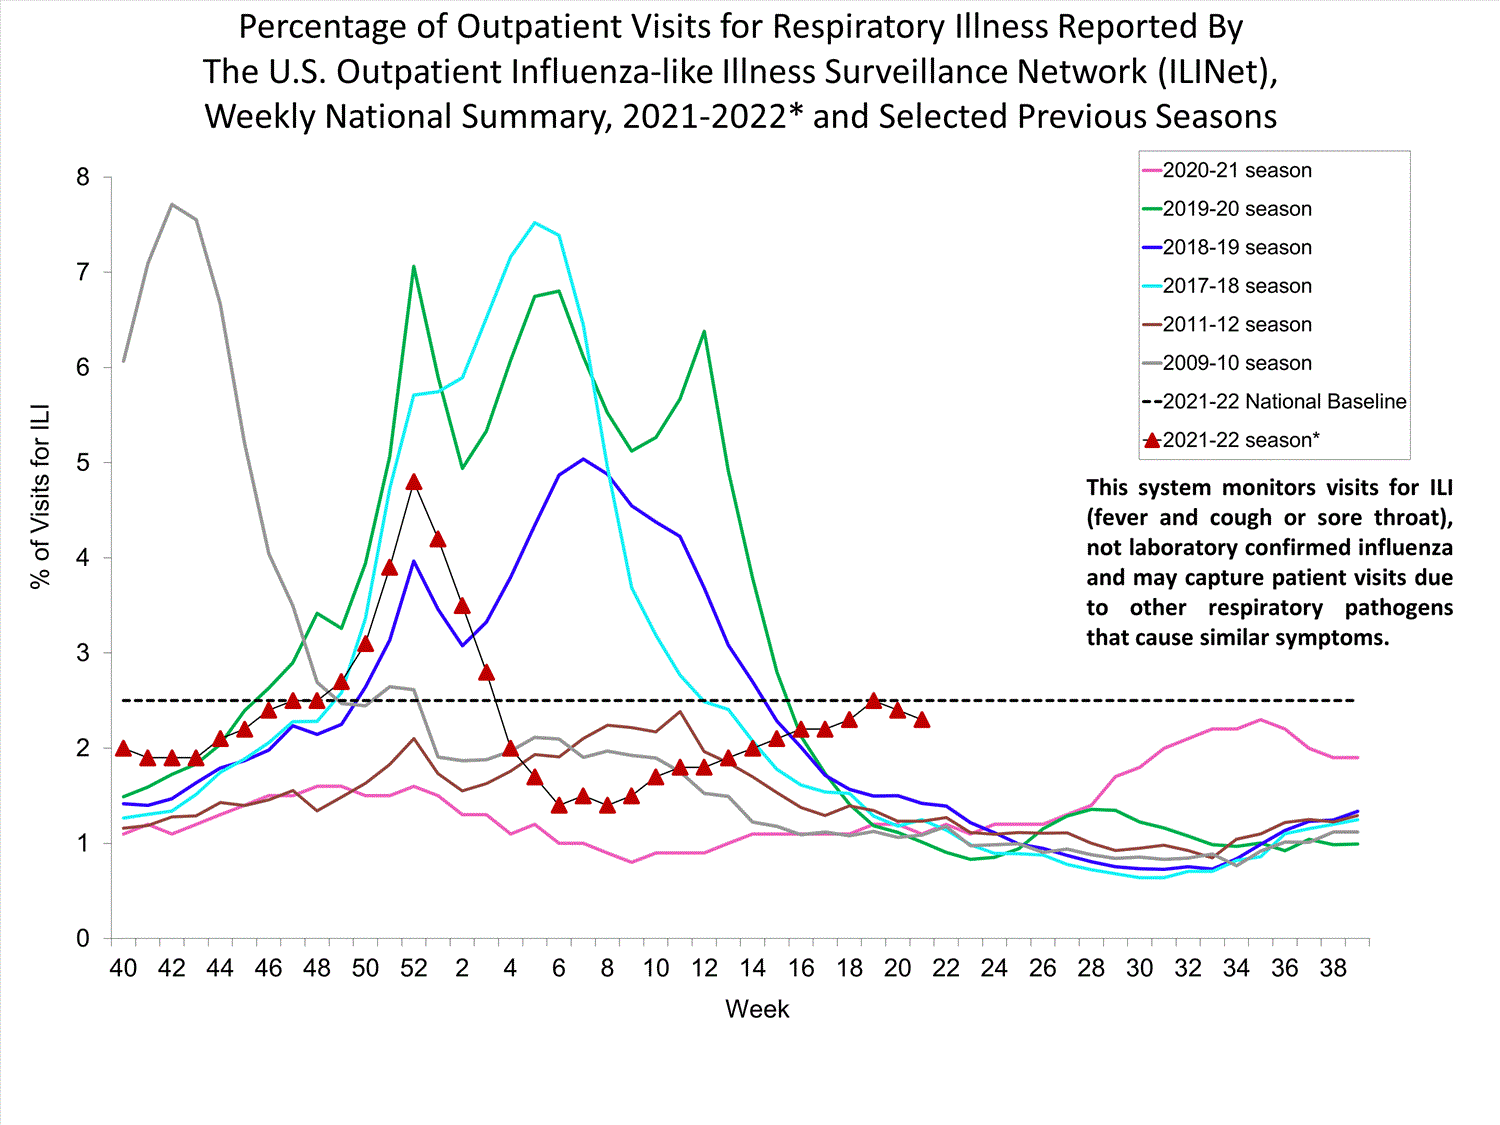
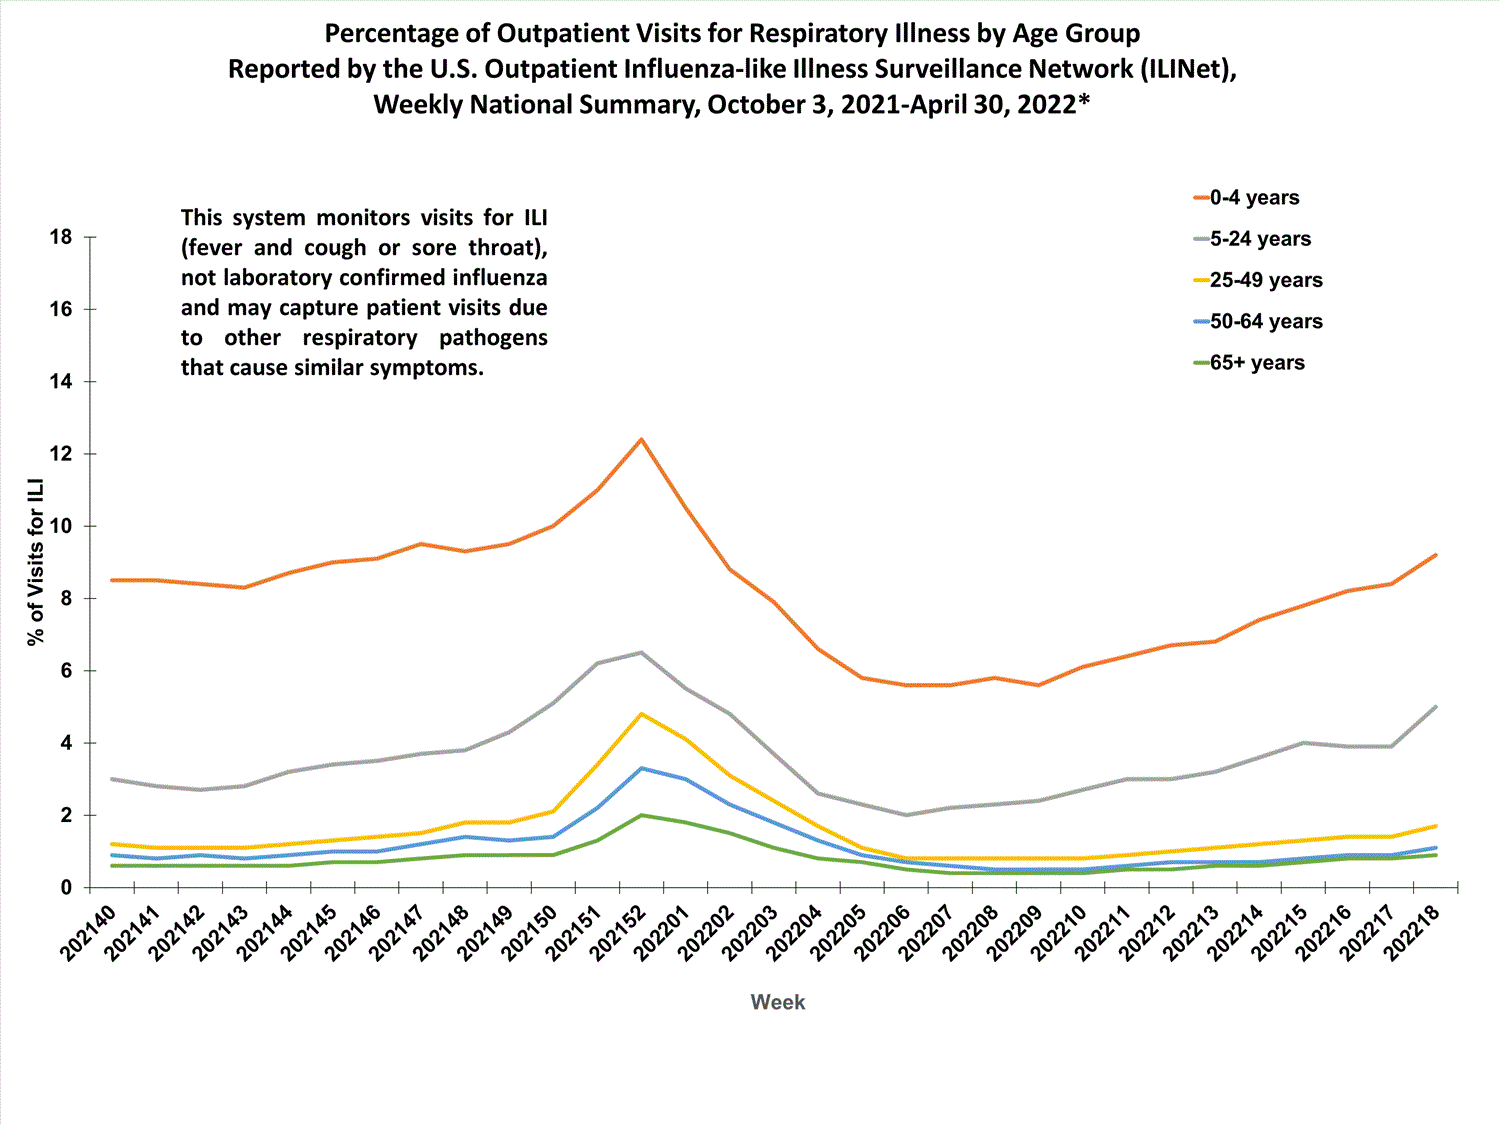
Nationwide during week 23, 2.1% of patient visits reported through ILINet were due to respiratory illness that included fever plus a cough or sore throat, also referred to as ILI. This is a decrease compared to week 22 and has been trending downward over the past four weeks. Nine of the 10 HHS regions are at or below their region-specific baselines; Region 3 is above their respective baseline. Multiple respiratory viruses are co-circulating, and the relative contribution of influenza virus infection to ILI varies by location.
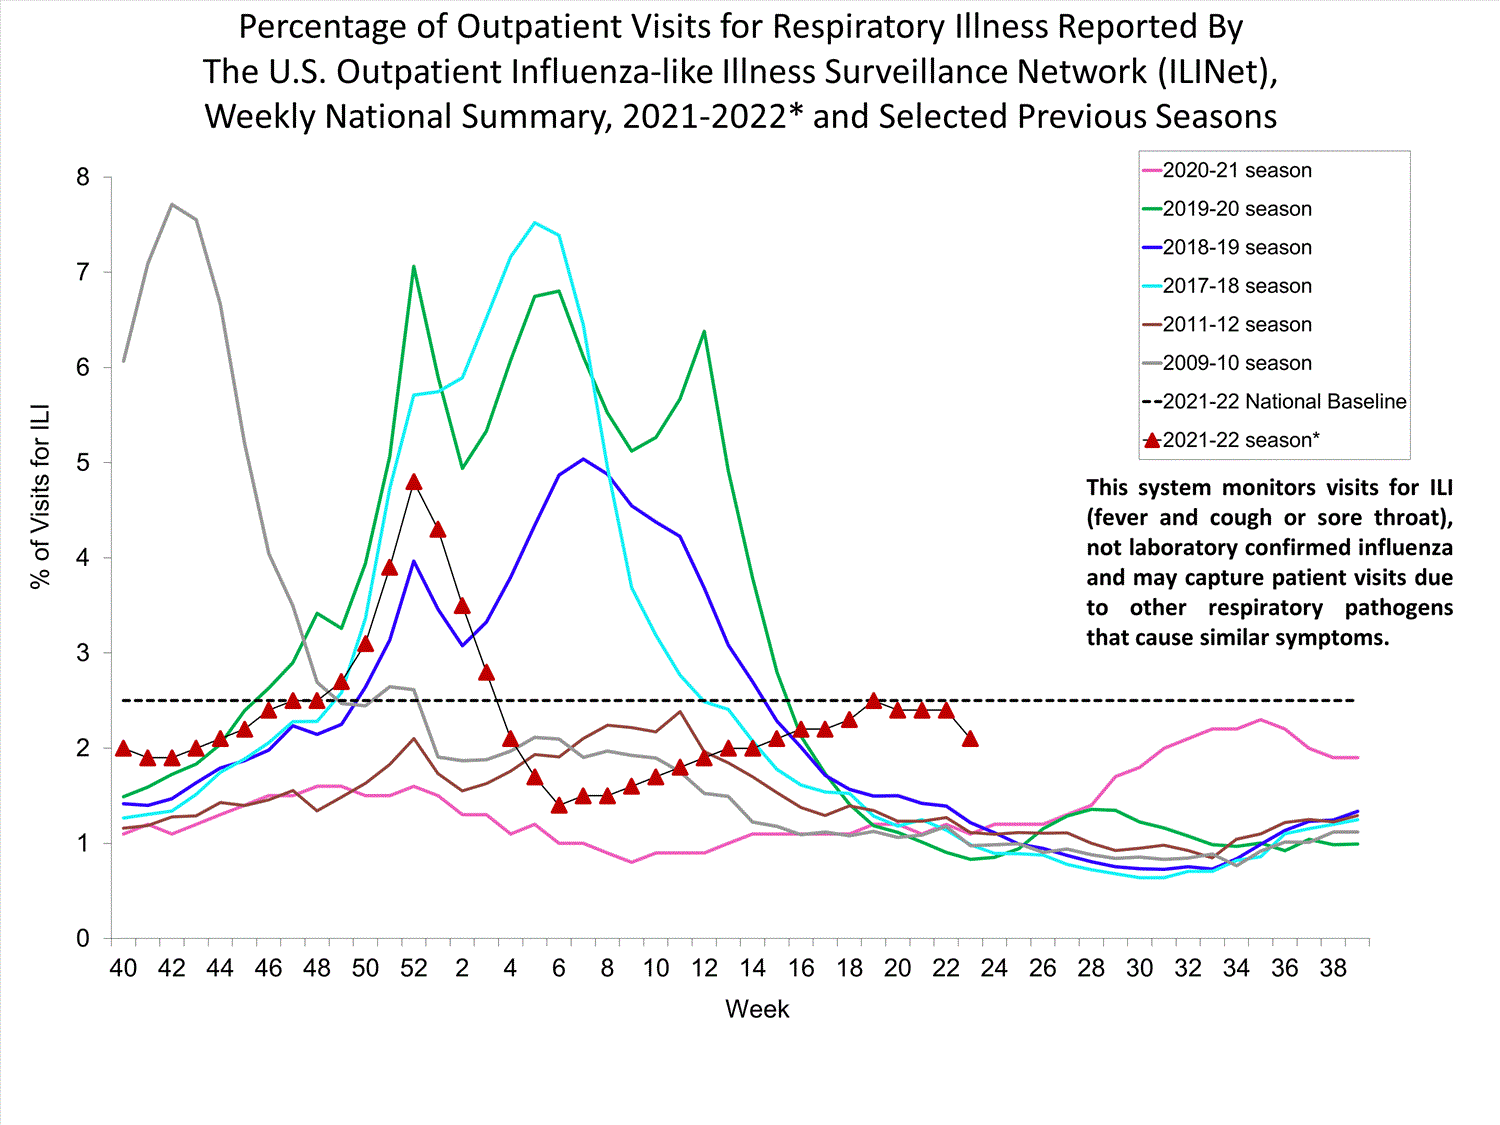
* Effective October 3, 2021 (week 40), the ILI definition (fever plus cough or sore throat) no longer includes “without a known cause other than influenza.”
View Chart Data (current season only) | View Full ScreenOutpatient Respiratory Illness Visits by Age Group
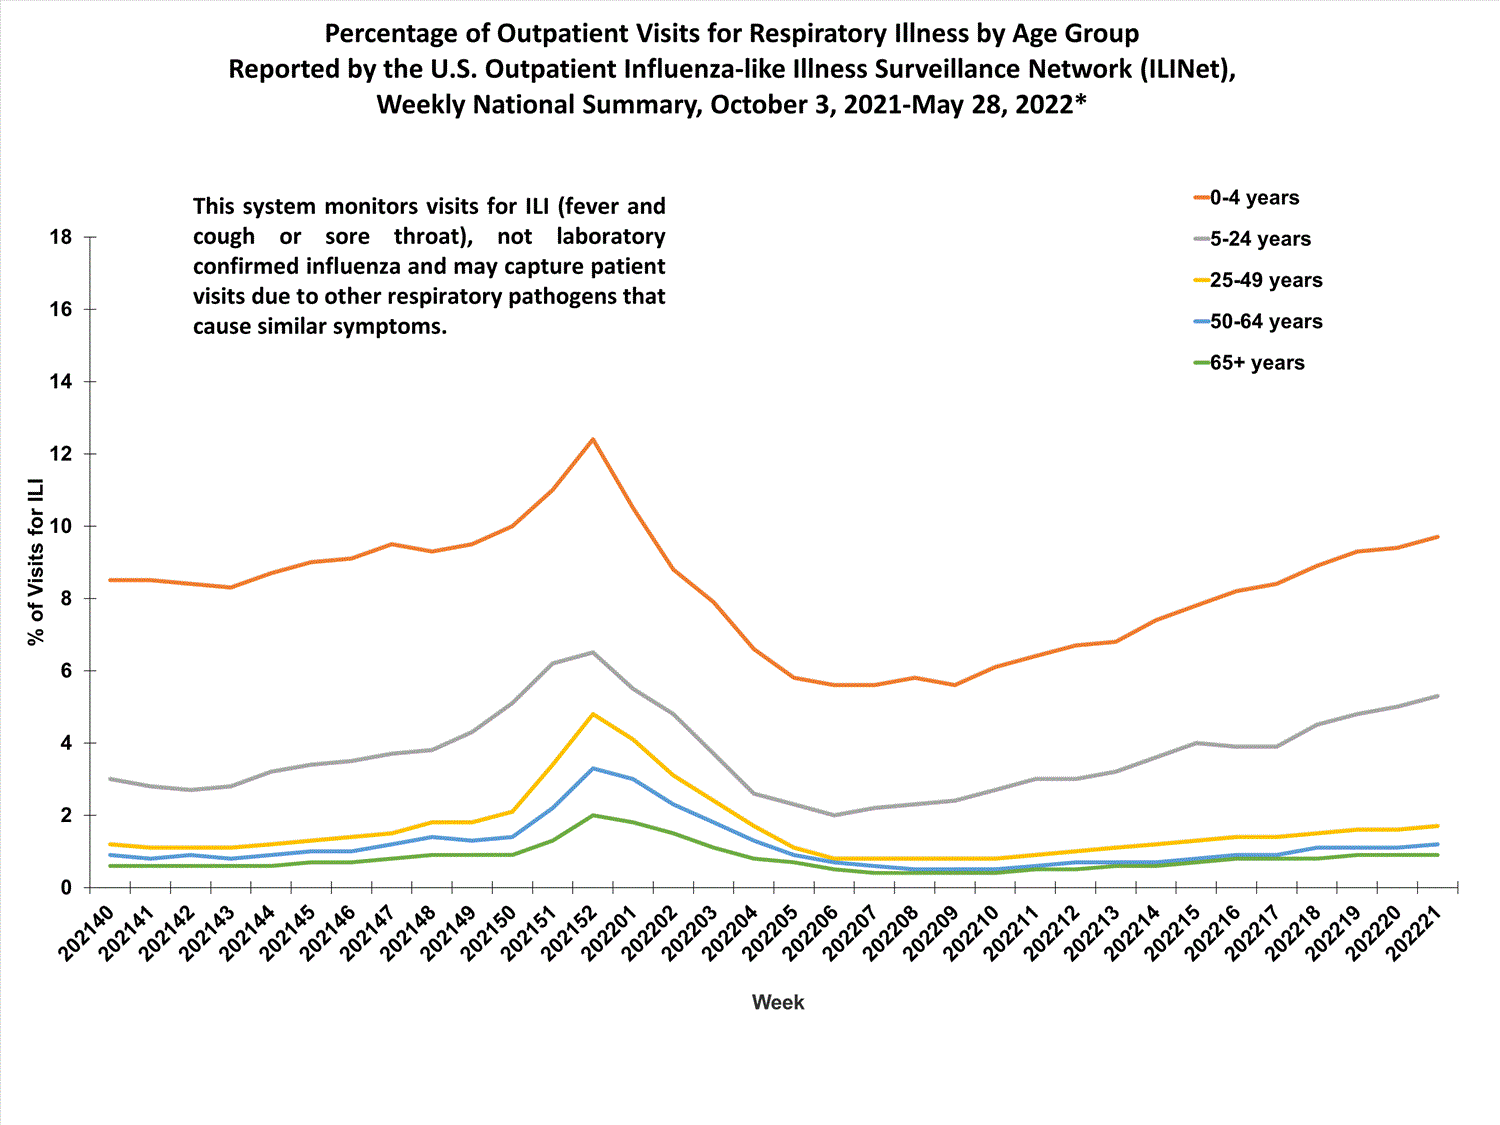
More than 70% of ILINet participants provide both the number of patient visits for respiratory illness and the total number of patient visits for the week broken out by age group. Data from this subset of providers are used to calculate the percentages of patient visits for respiratory illness by age group.
The percentage of visits for respiratory illness reported in ILINet has been trending downward or remaining stable for all age groups.
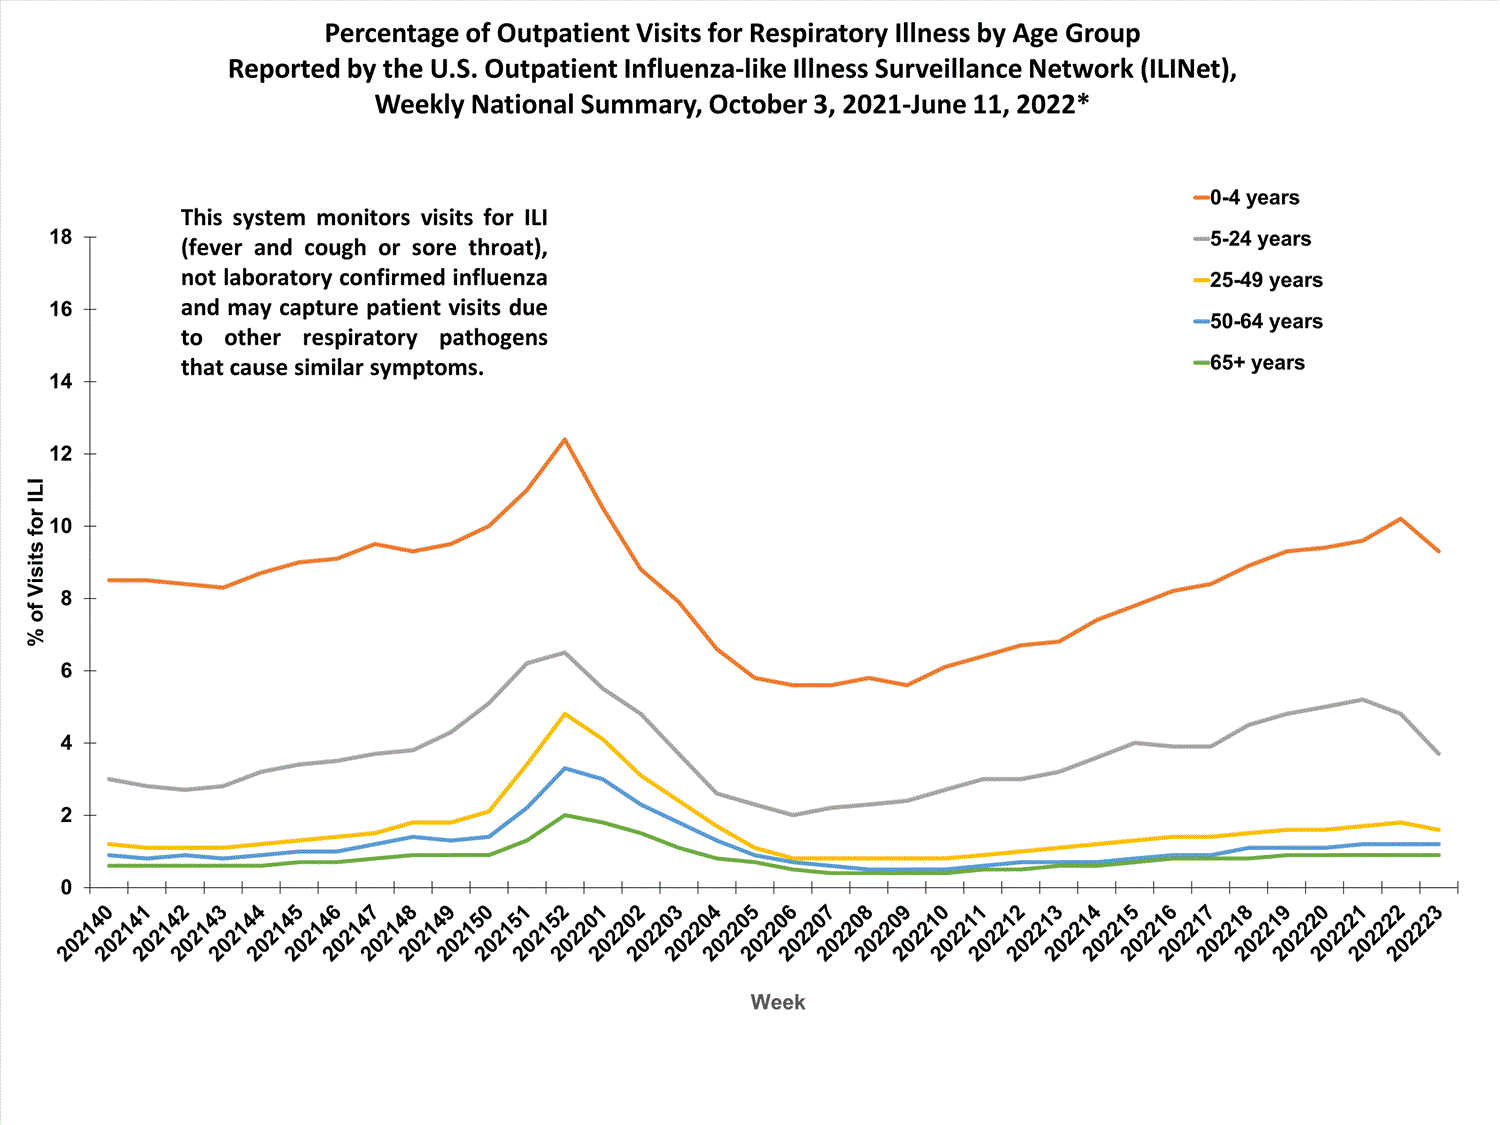
* Effective October 3, 2021 (week 40), the ILI definition (fever plus cough or sore throat) no longer includes “without a known cause other than influenza.”
View Chart Data | View Full Screen
Outpatient Respiratory Illness Activity Map
Data collected in ILINet are used to produce a measure of ILI activity* by state/jurisdiction and Core Based Statistical Areas (CBSA).
| Week 23 (Week ending Jun. 11, 2022) |
Week 22 (Week ending Jun. 4, 2022) |
Week 23 (Week ending Jun. 11, 2022) |
Week 22 (Week ending Jun. 4, 2022) |
|
| Very High | 0 | 1 | 2 | 6 |
| High | 3 | 3 | 13 | 20 |
| Moderate | 2 | 0 | 26 | 21 |
| Low | 5 | 9 | 60 | 79 |
| Minimal | 45 | 41 | 548 | 523 |
| Insufficient Data | 0 | 1 | 280 | 280 |
*Data collected in ILINet may disproportionally represent certain populations within a jurisdiction or CBSA, and therefore, may not accurately depict the full picture of influenza activity for the entire jurisdiction or CBSA. Differences in the data presented here by CDC and independently by some health departments likely represent differing levels of data completeness with data presented by the health department likely being the more complete.
Additional information about medically attended visits for ILI for current and past seasons:
Surveillance Methods | FluView Interactive: National, Regional, and State Data or ILI Activity Map
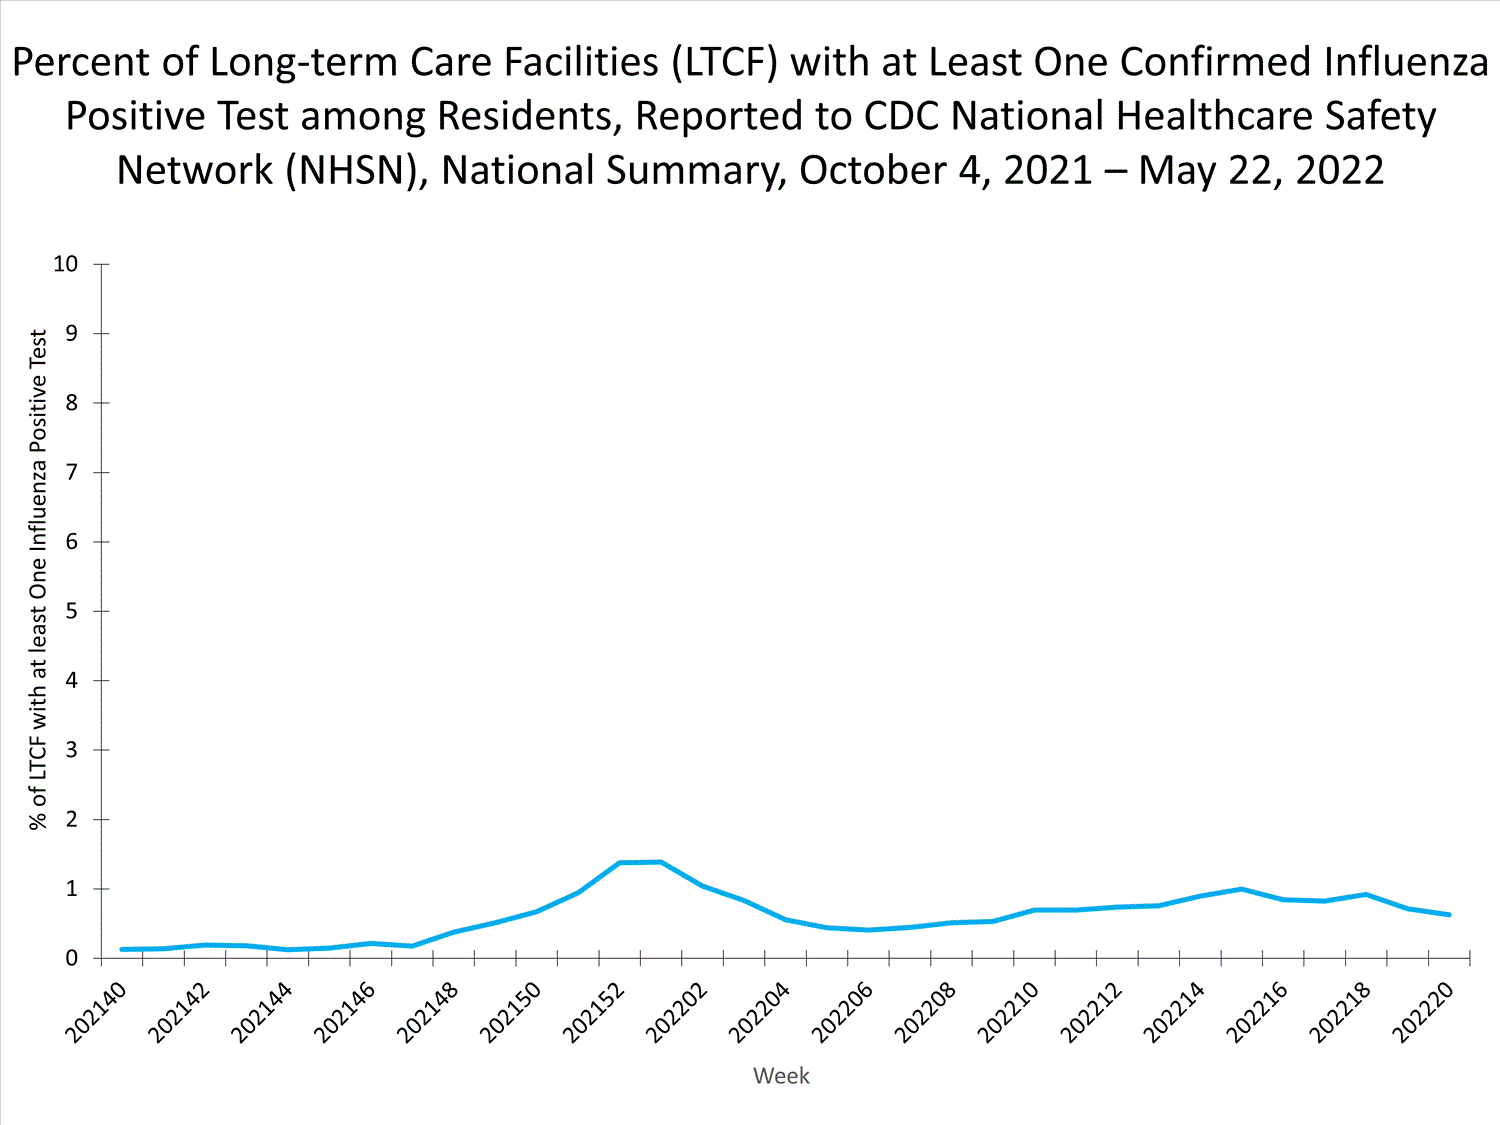
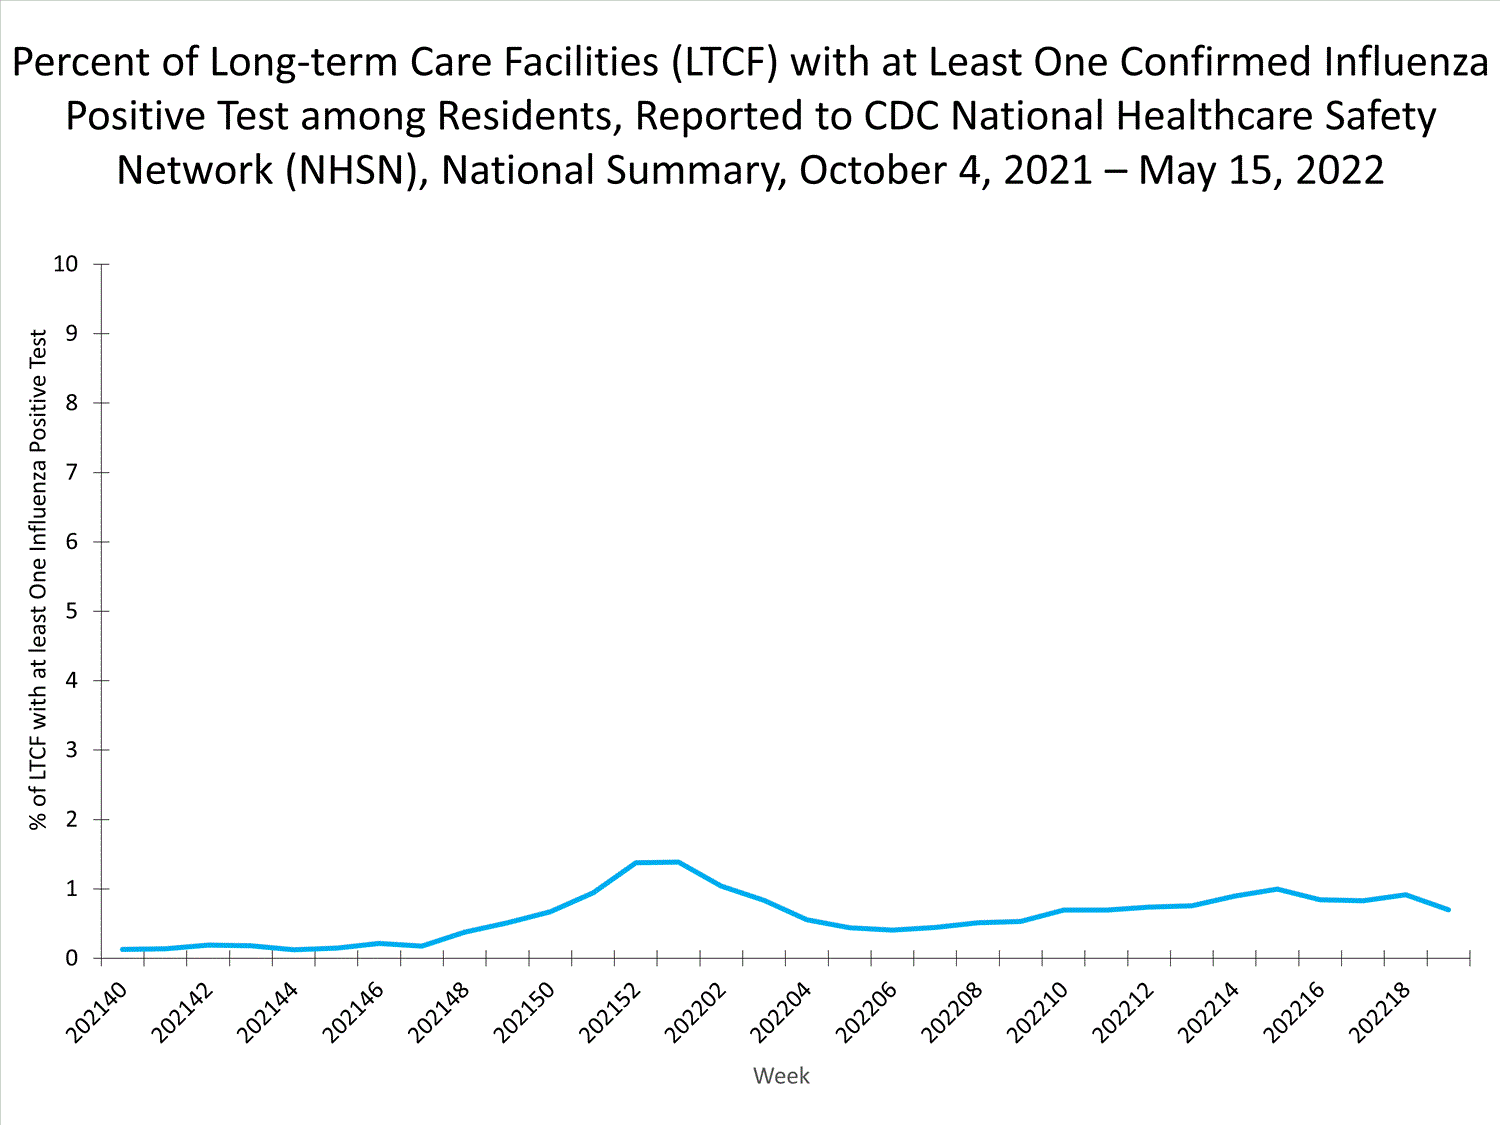
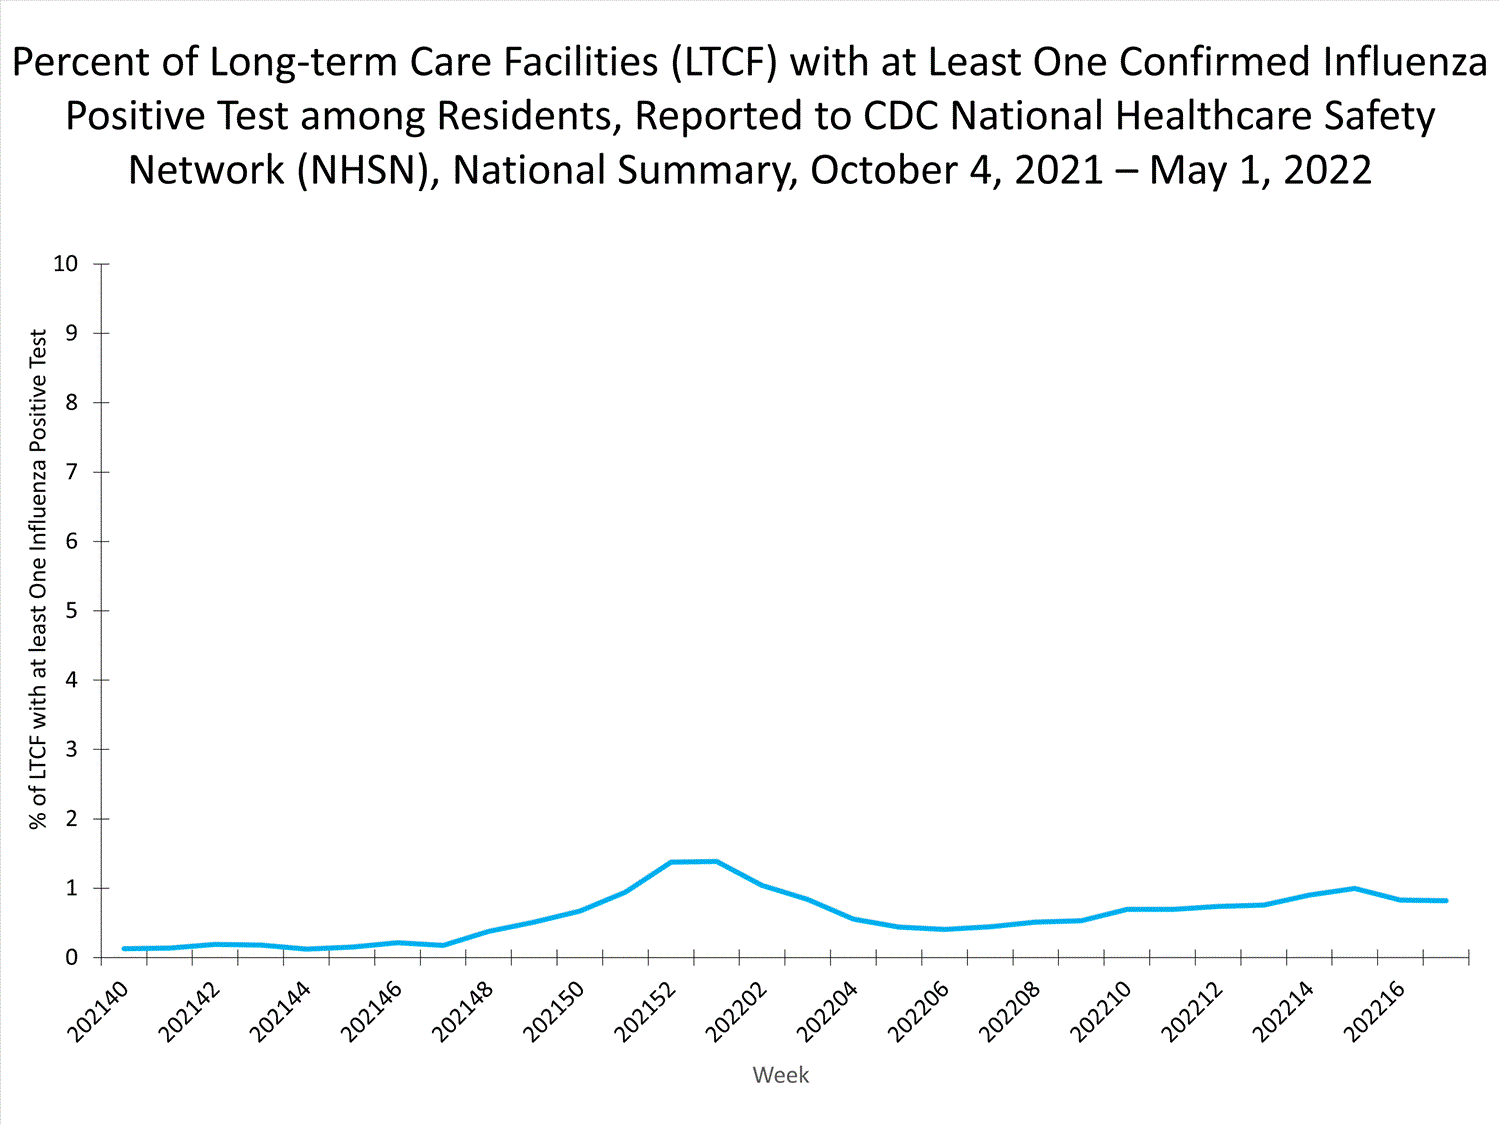
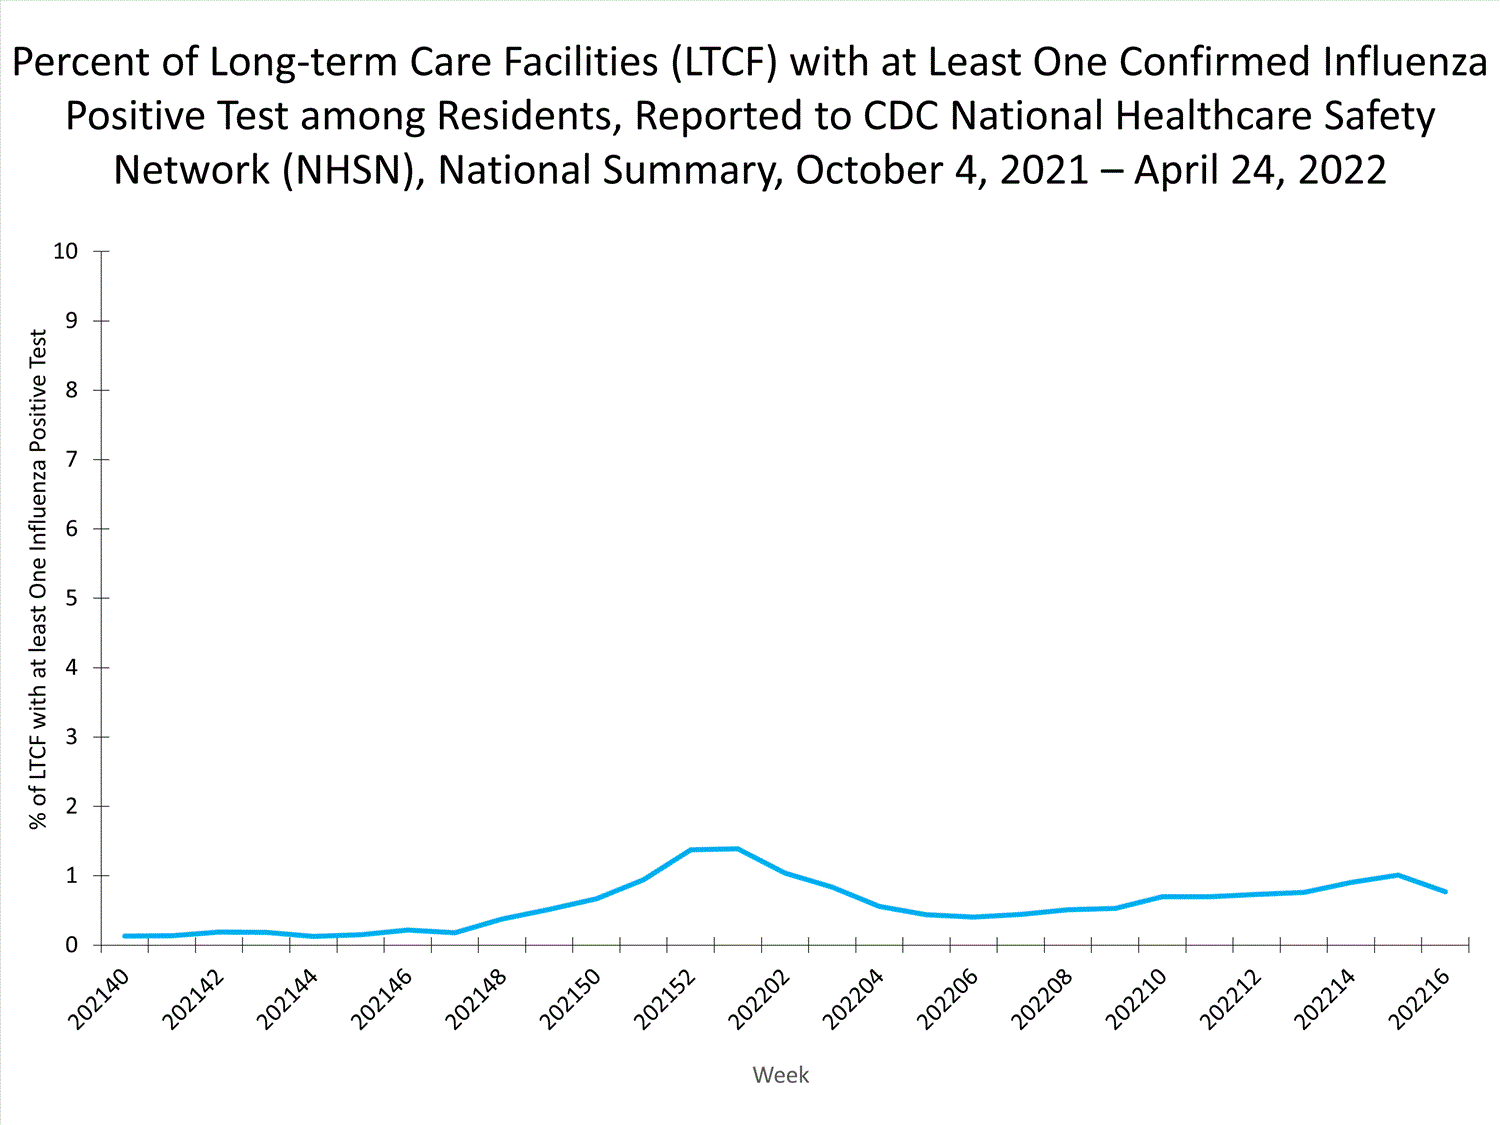
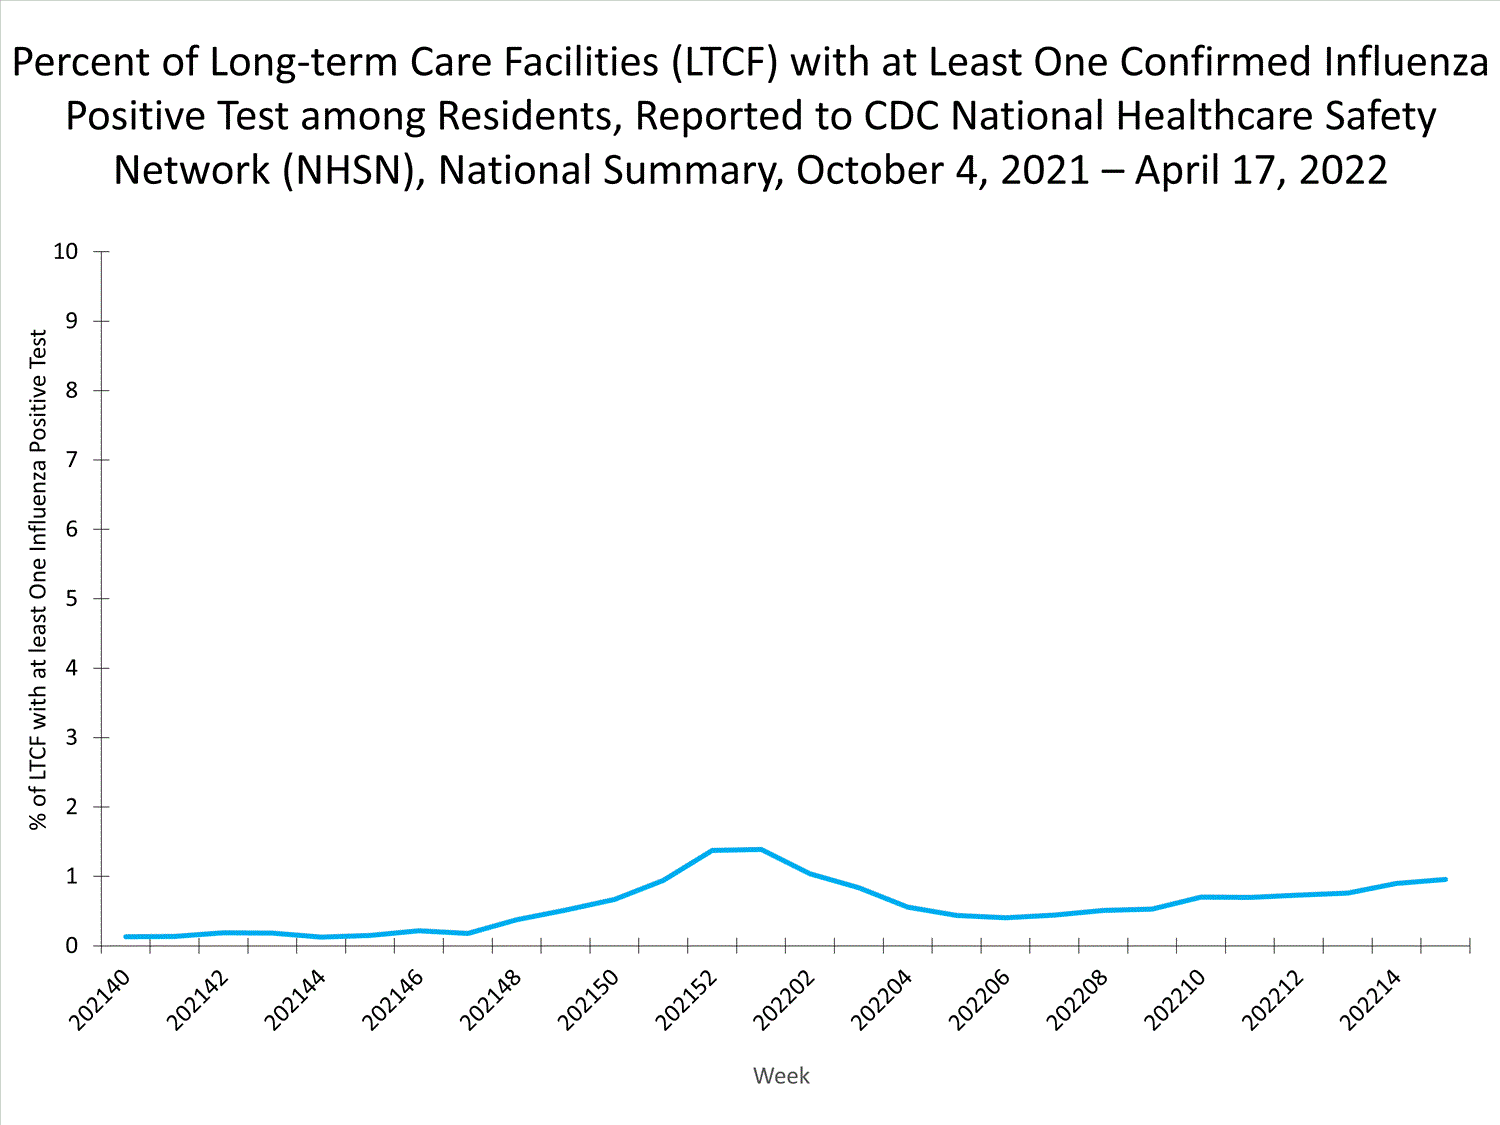
Long-term Care Facility (LTCF) Surveillance
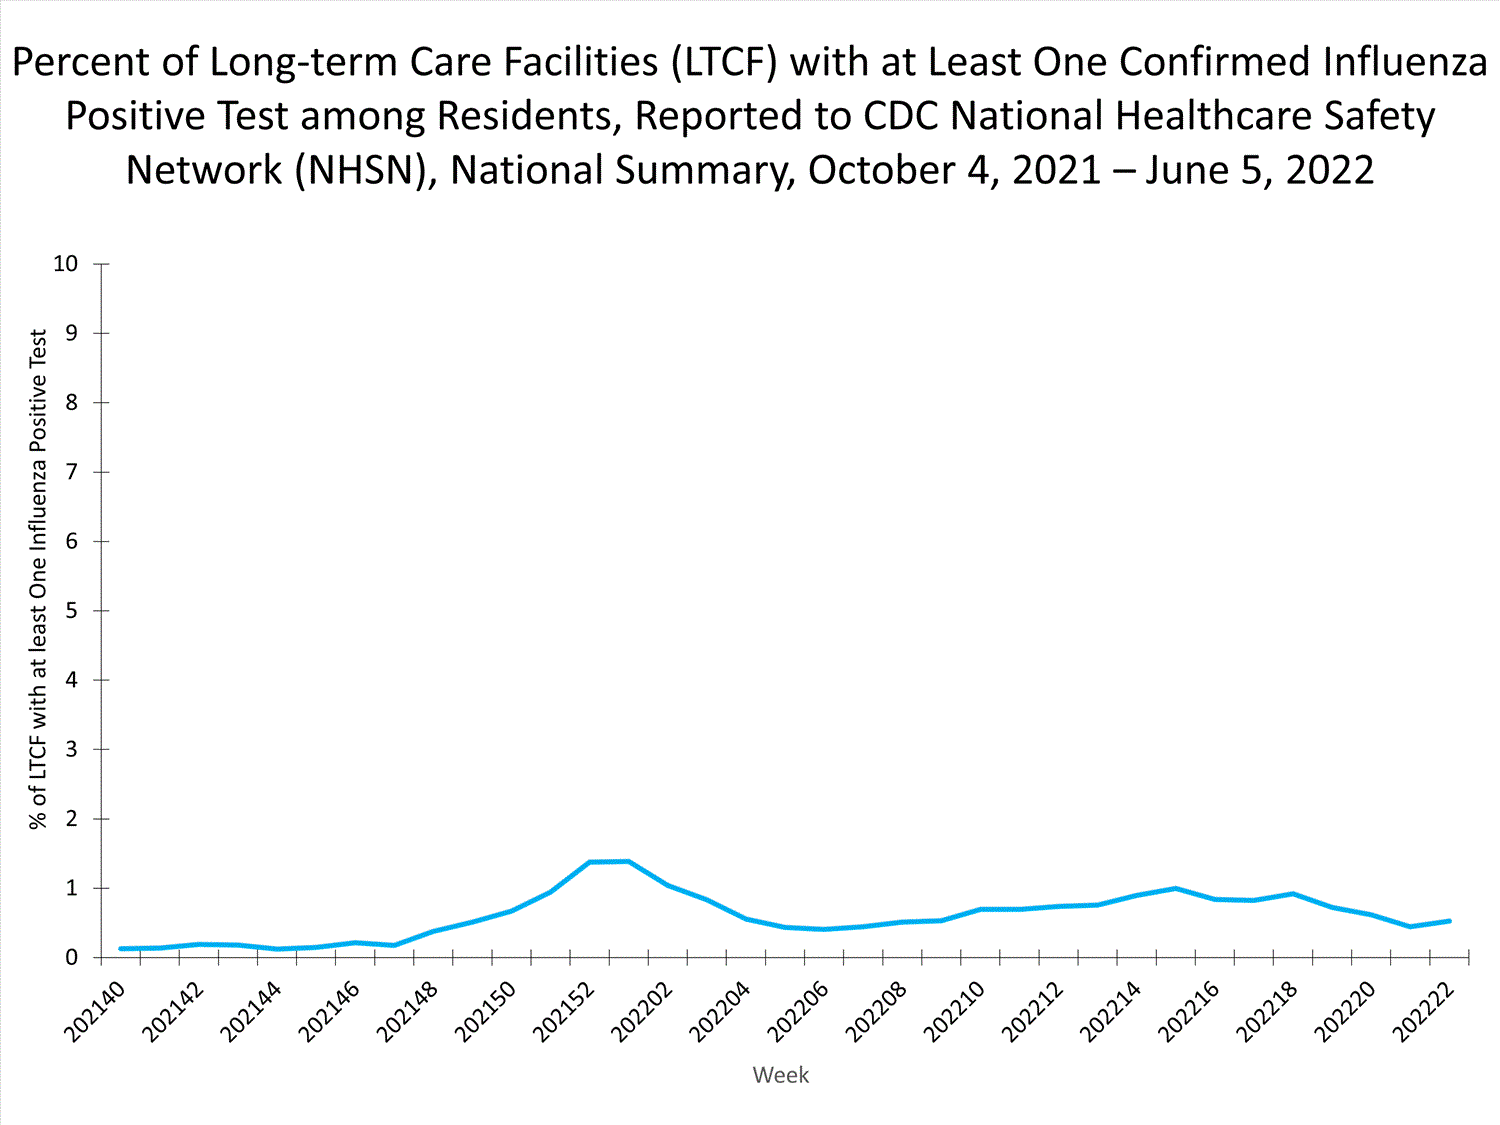
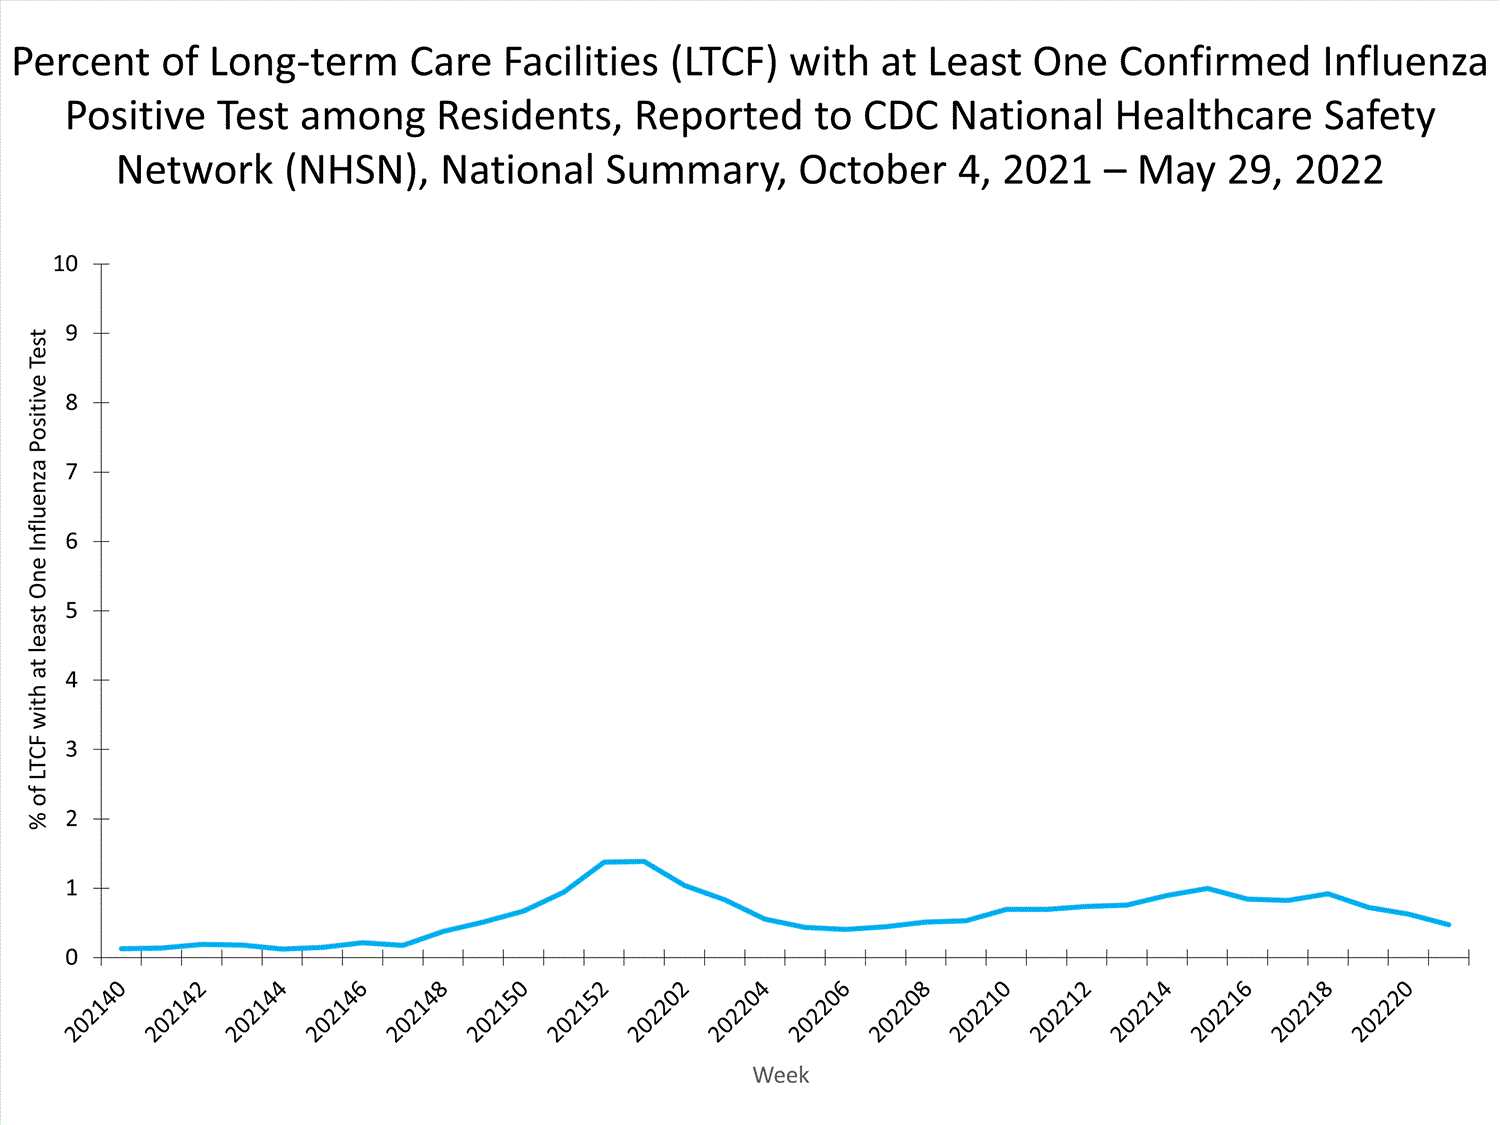
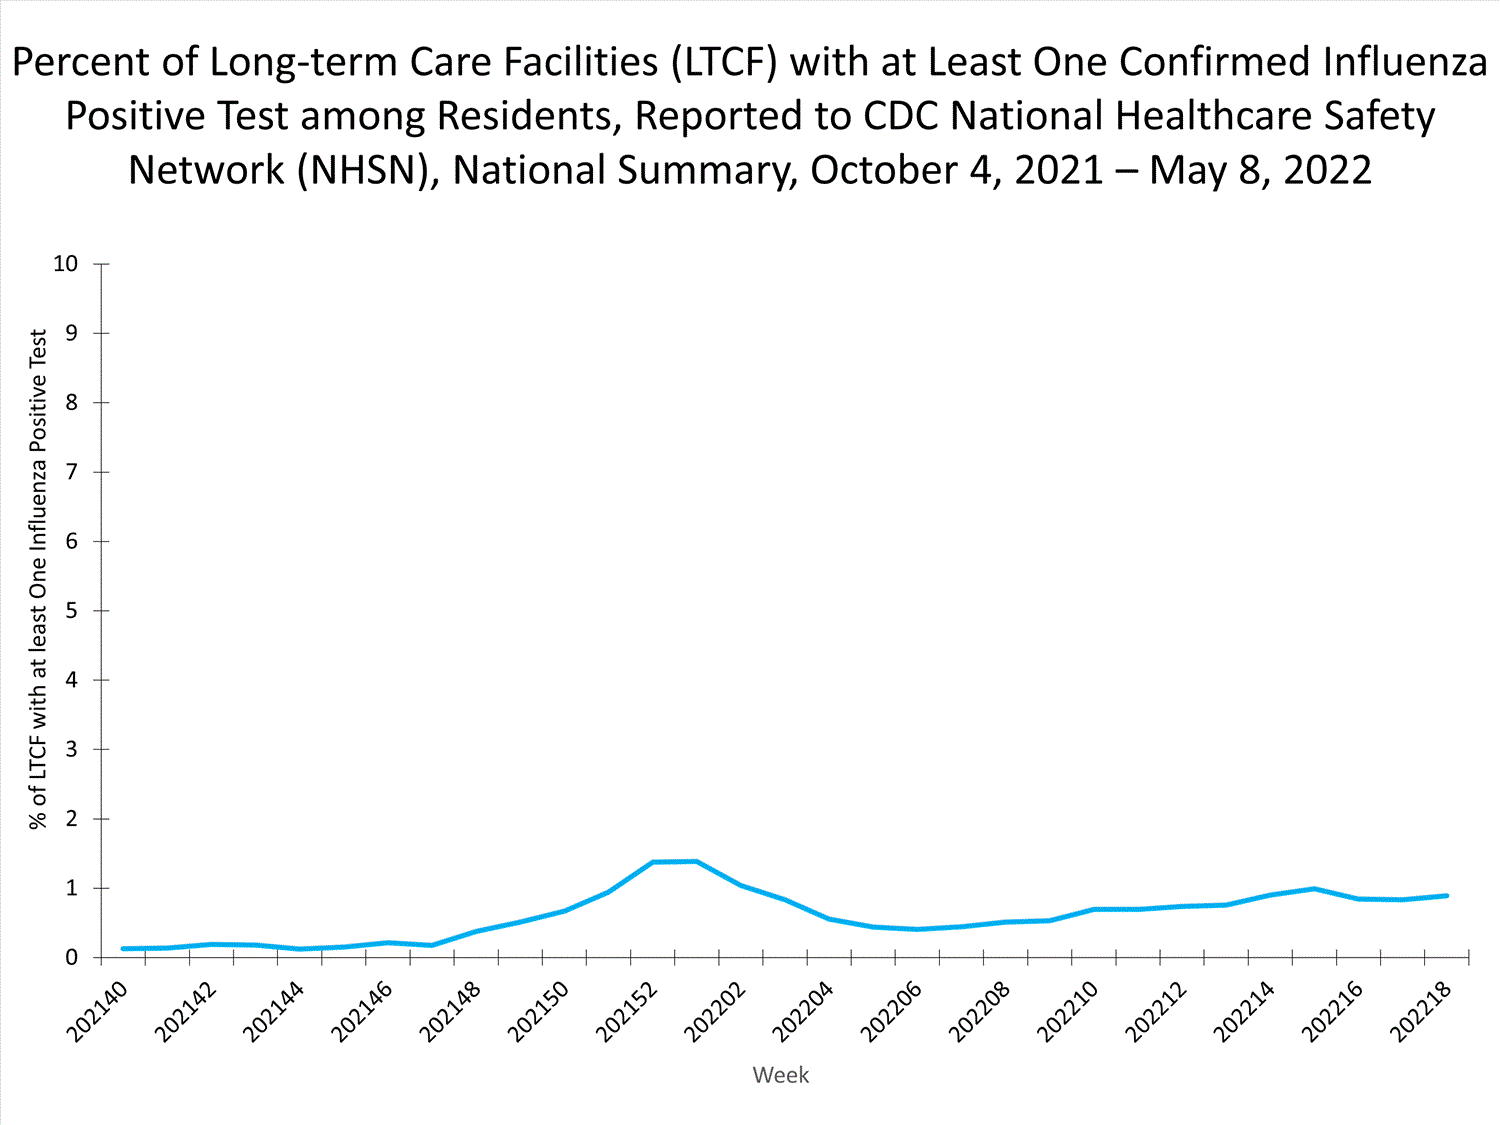
LTCFs (e.g., nursing homes/skilled nursing, long-term care for the developmentally disabled, and assisted living facilities) from all 50 states and U.S. territories report data on influenza virus infections among residents through the National Healthcare Safety Network (NHSN) Long-term Care Facility Component. During week 23, 55 (0.4%) of 14,471 reporting LTCFs reported at least one influenza positive test among their residents.
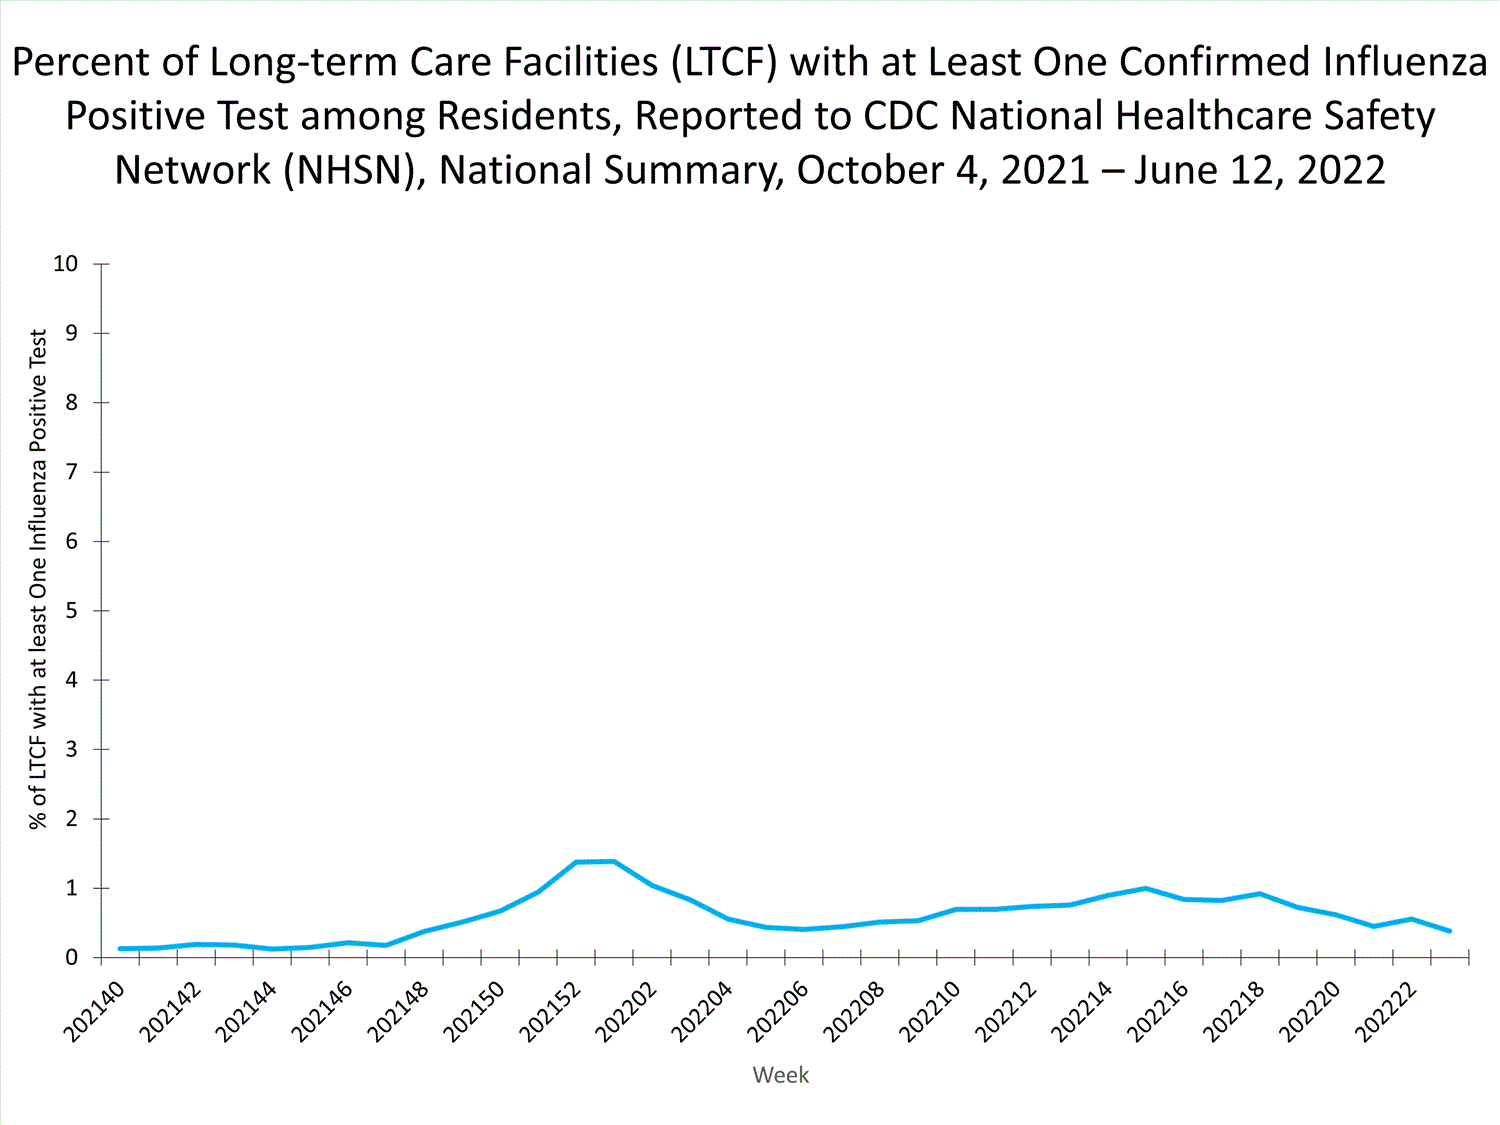
View Chart Data | View Full Screen
Additional information about long-term care facility surveillance:
Surveillance Methods | Additional Data
Hospitalization Surveillance
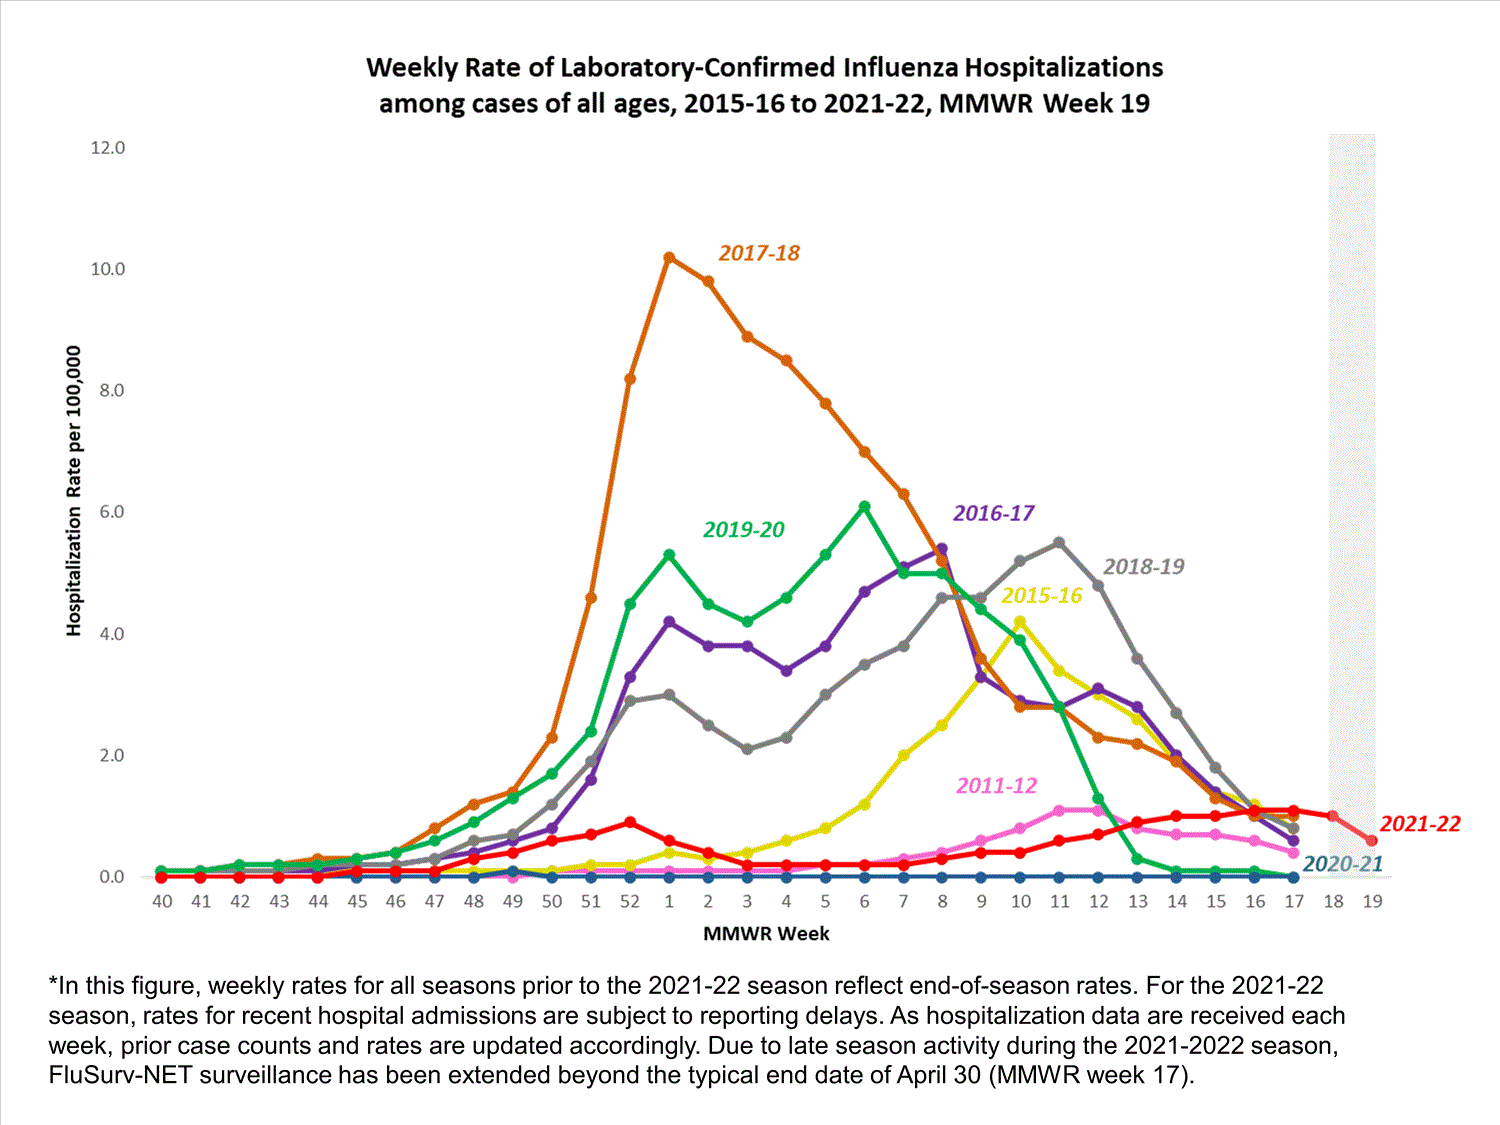
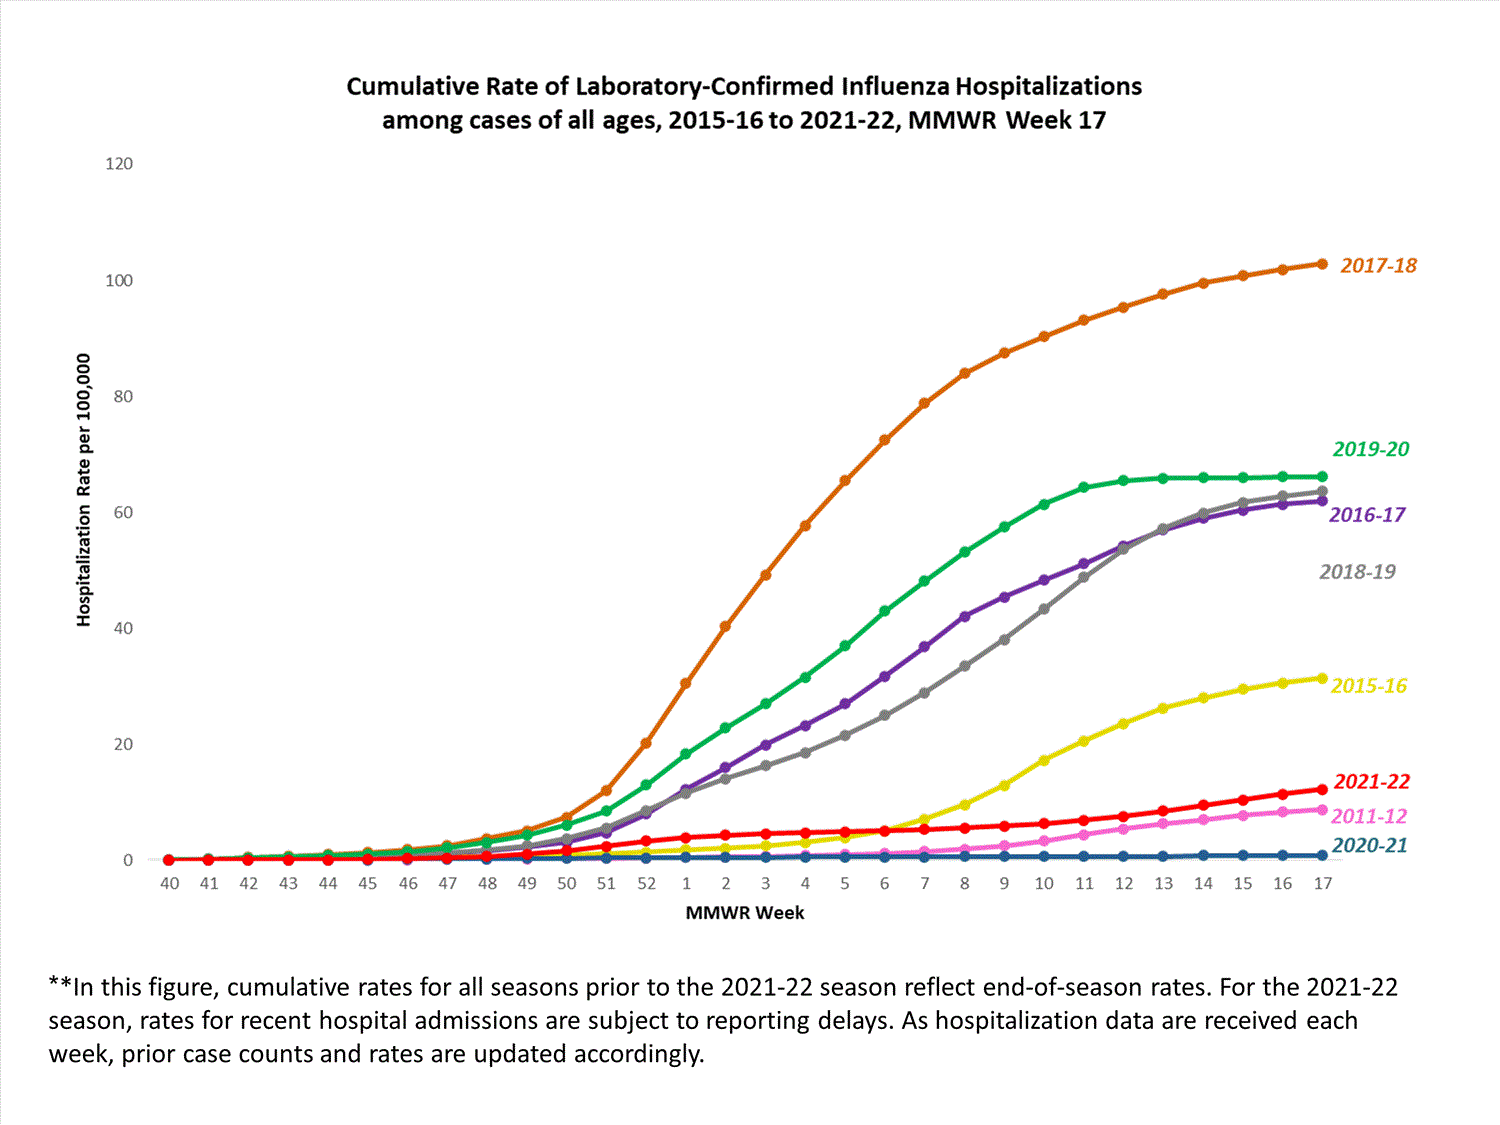
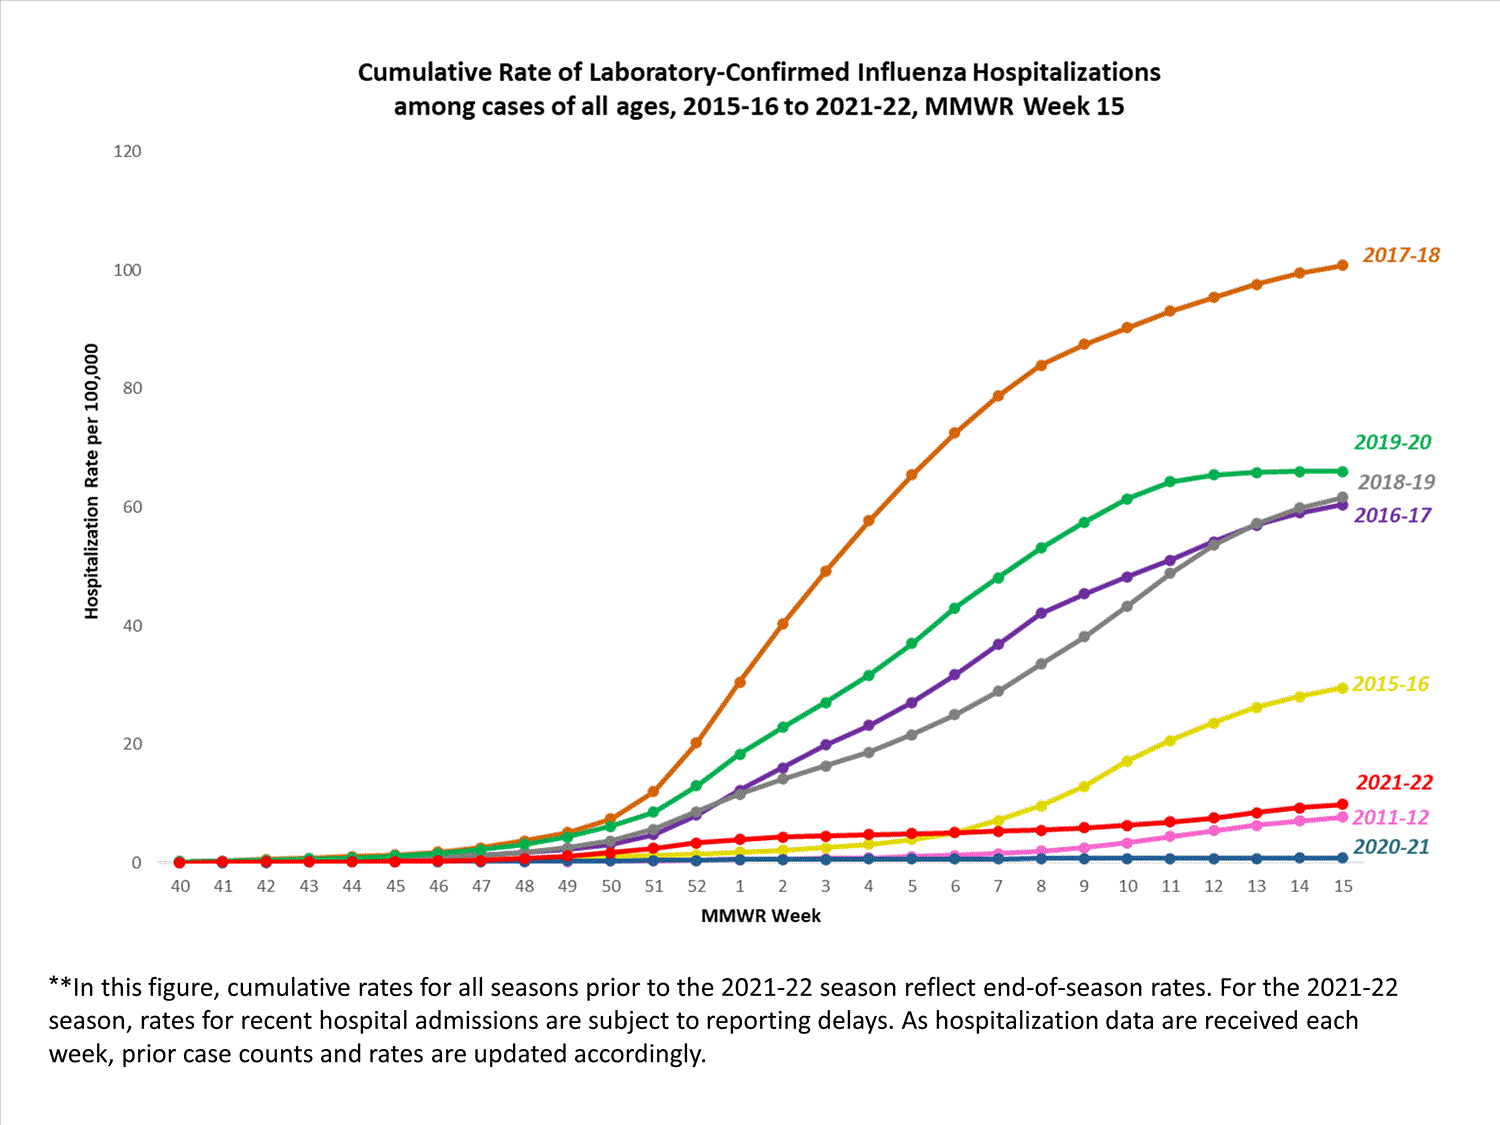
FluSurv-NET
The Influenza Hospitalization Surveillance Network (FluSurv-NET) conducts population-based surveillance for laboratory-confirmed influenza-related hospitalizations in select counties in 14 states and represents approximately 9% of the U.S. population. FluSurv-NET hospitalization data are preliminary. As data are received each week, prior case counts and rates are updated accordingly.
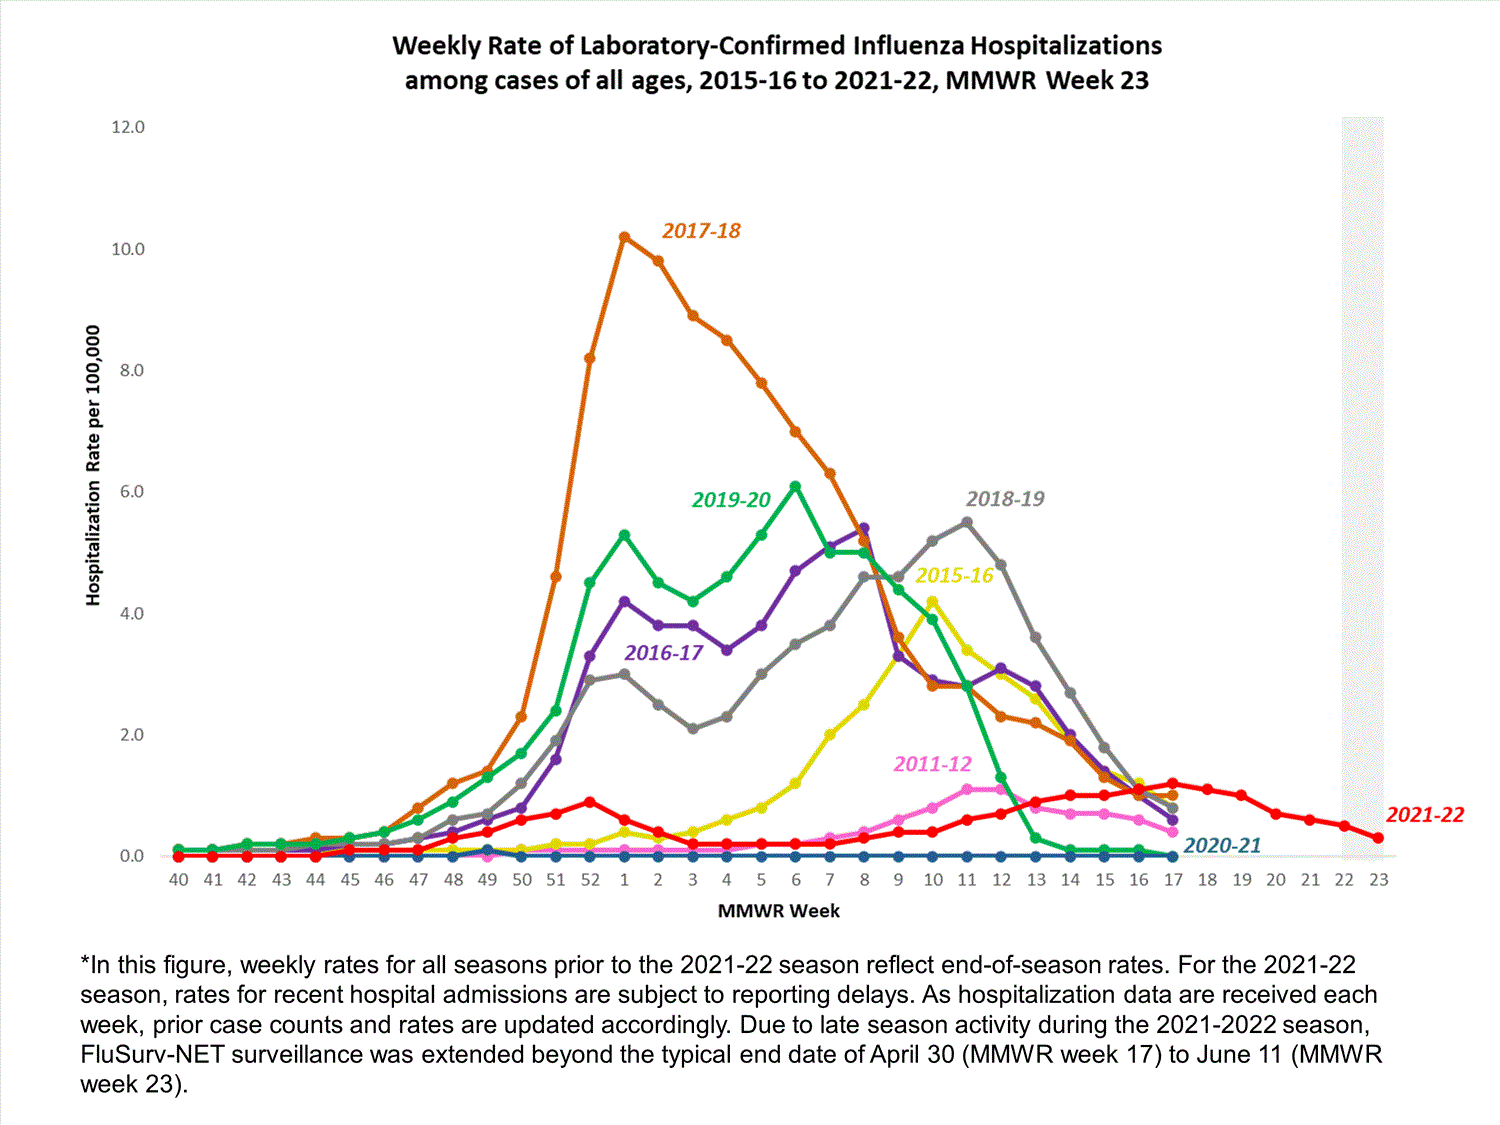
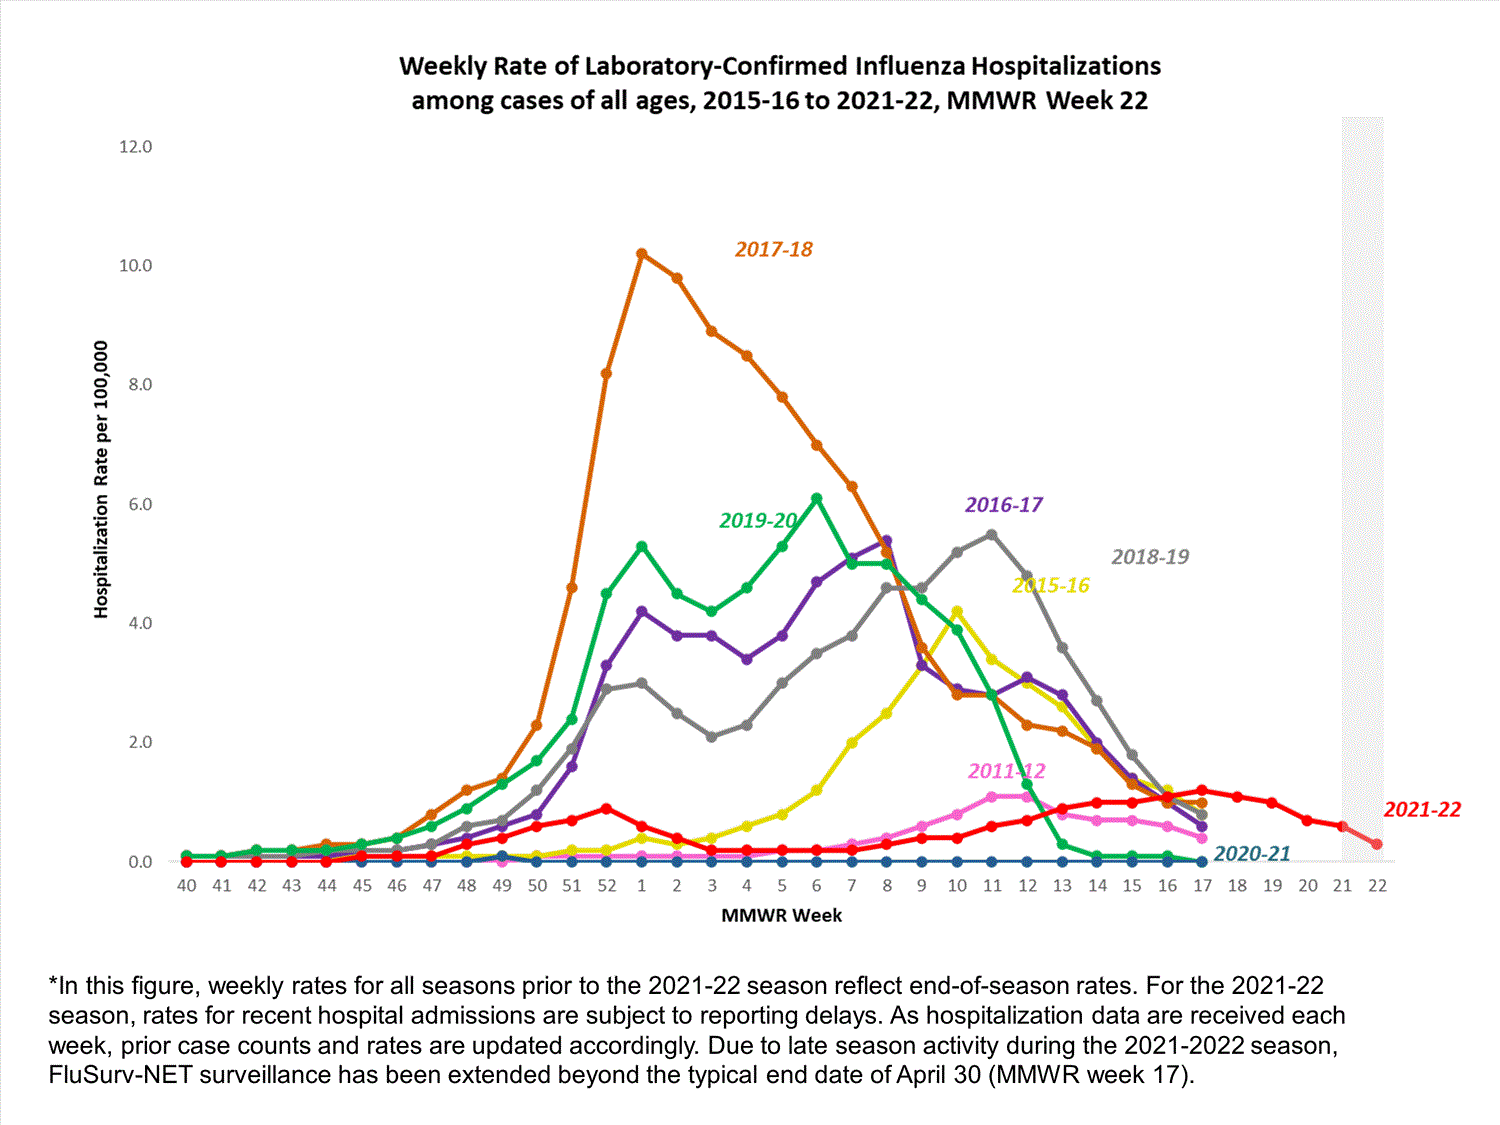
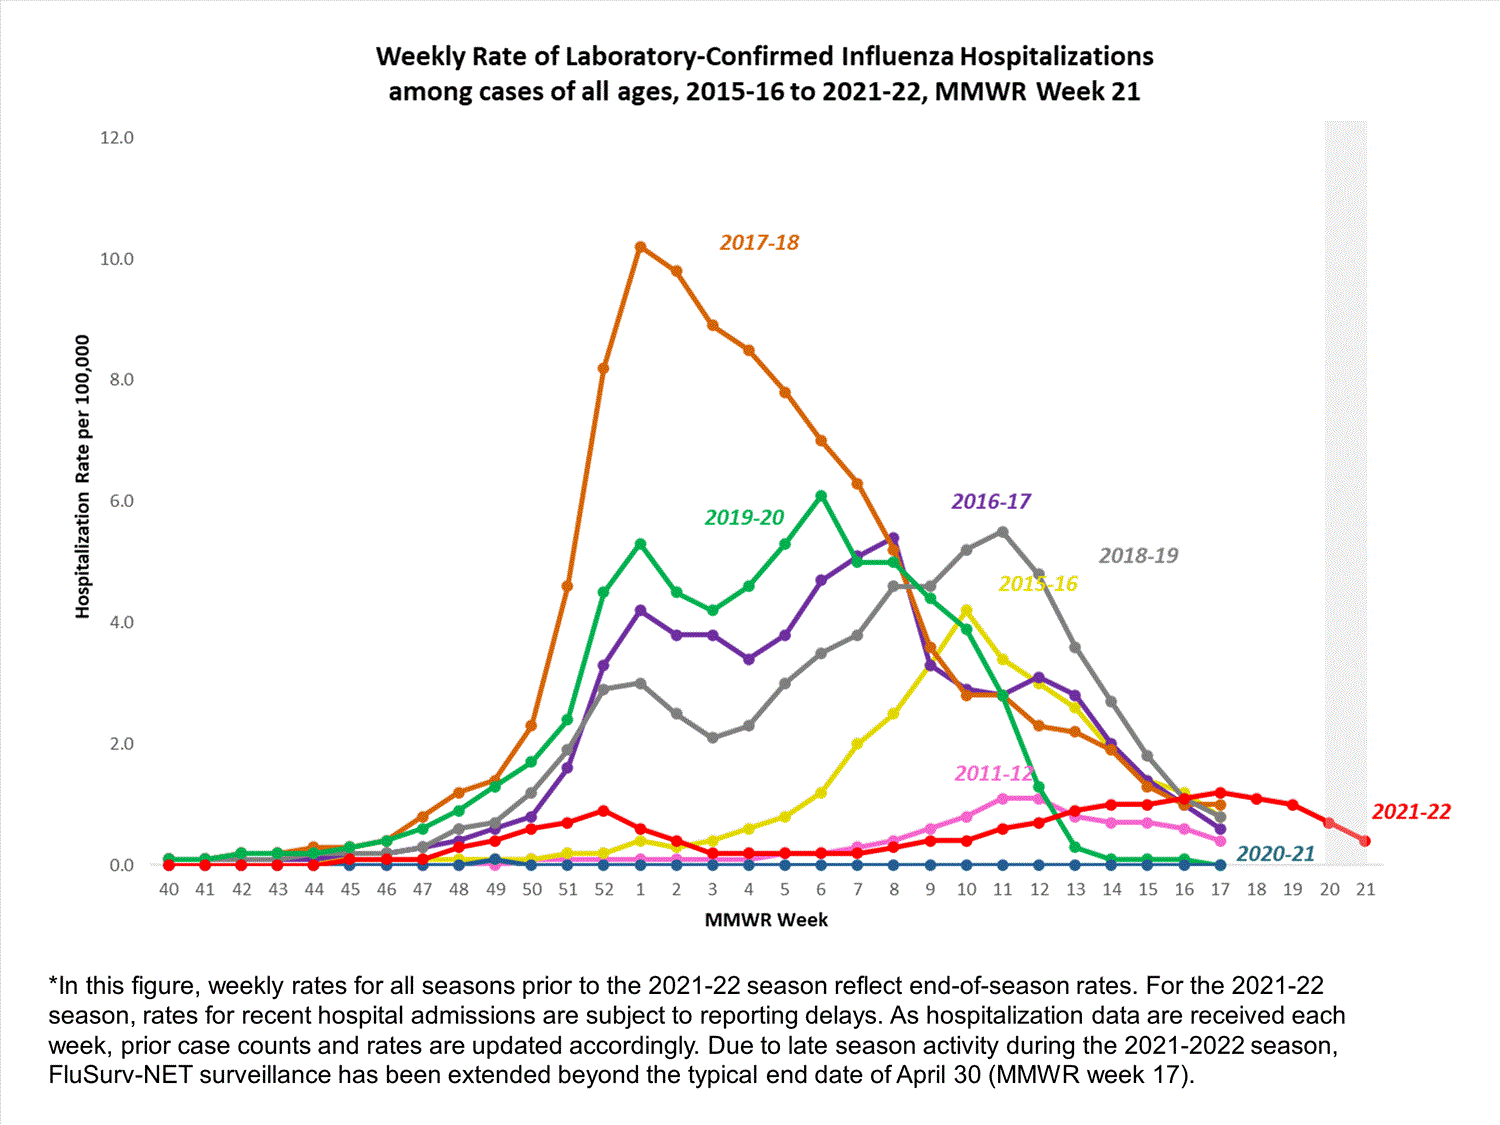
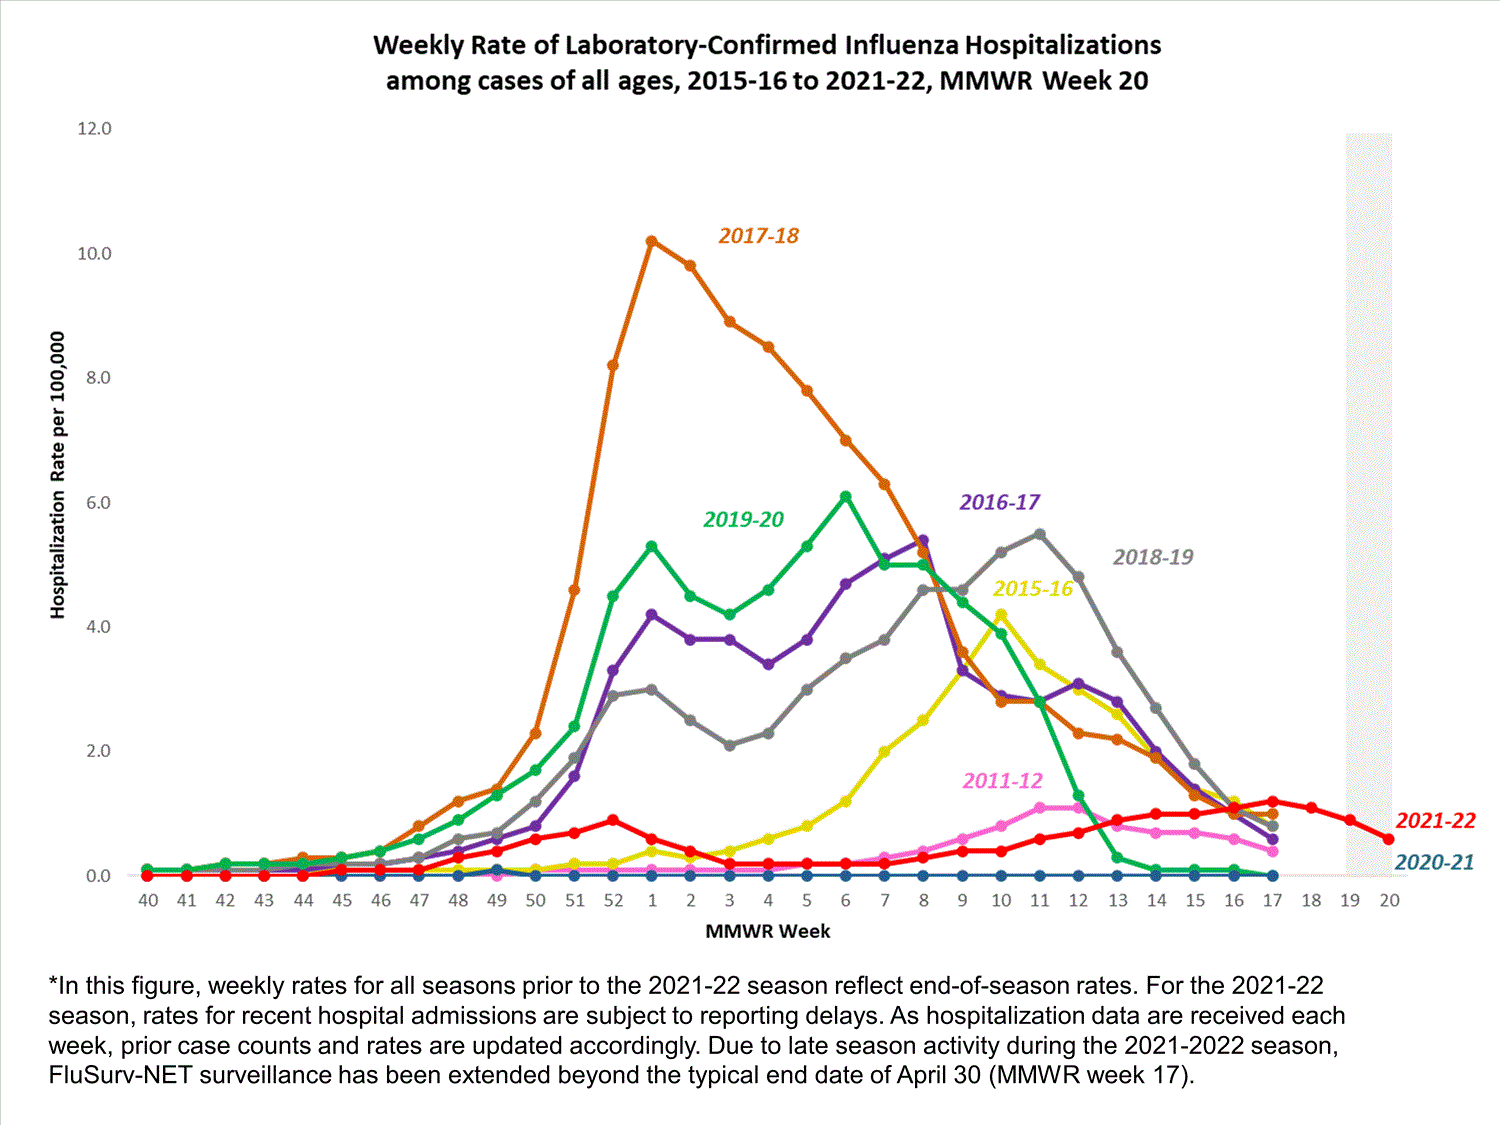
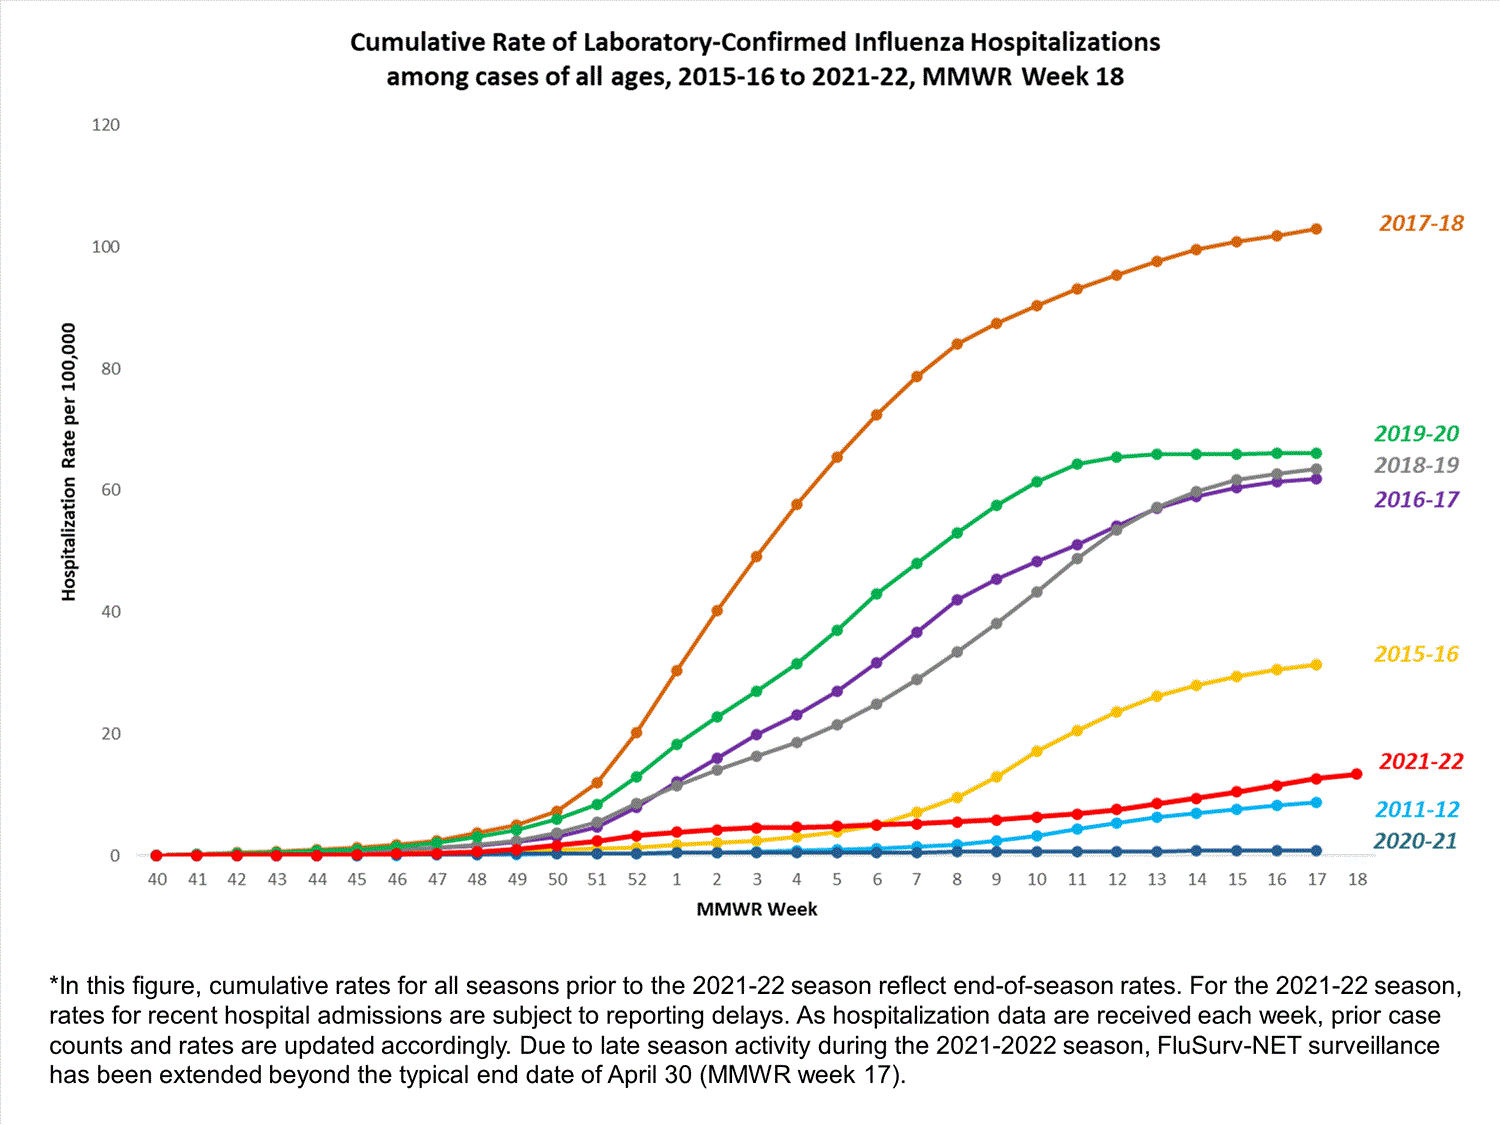
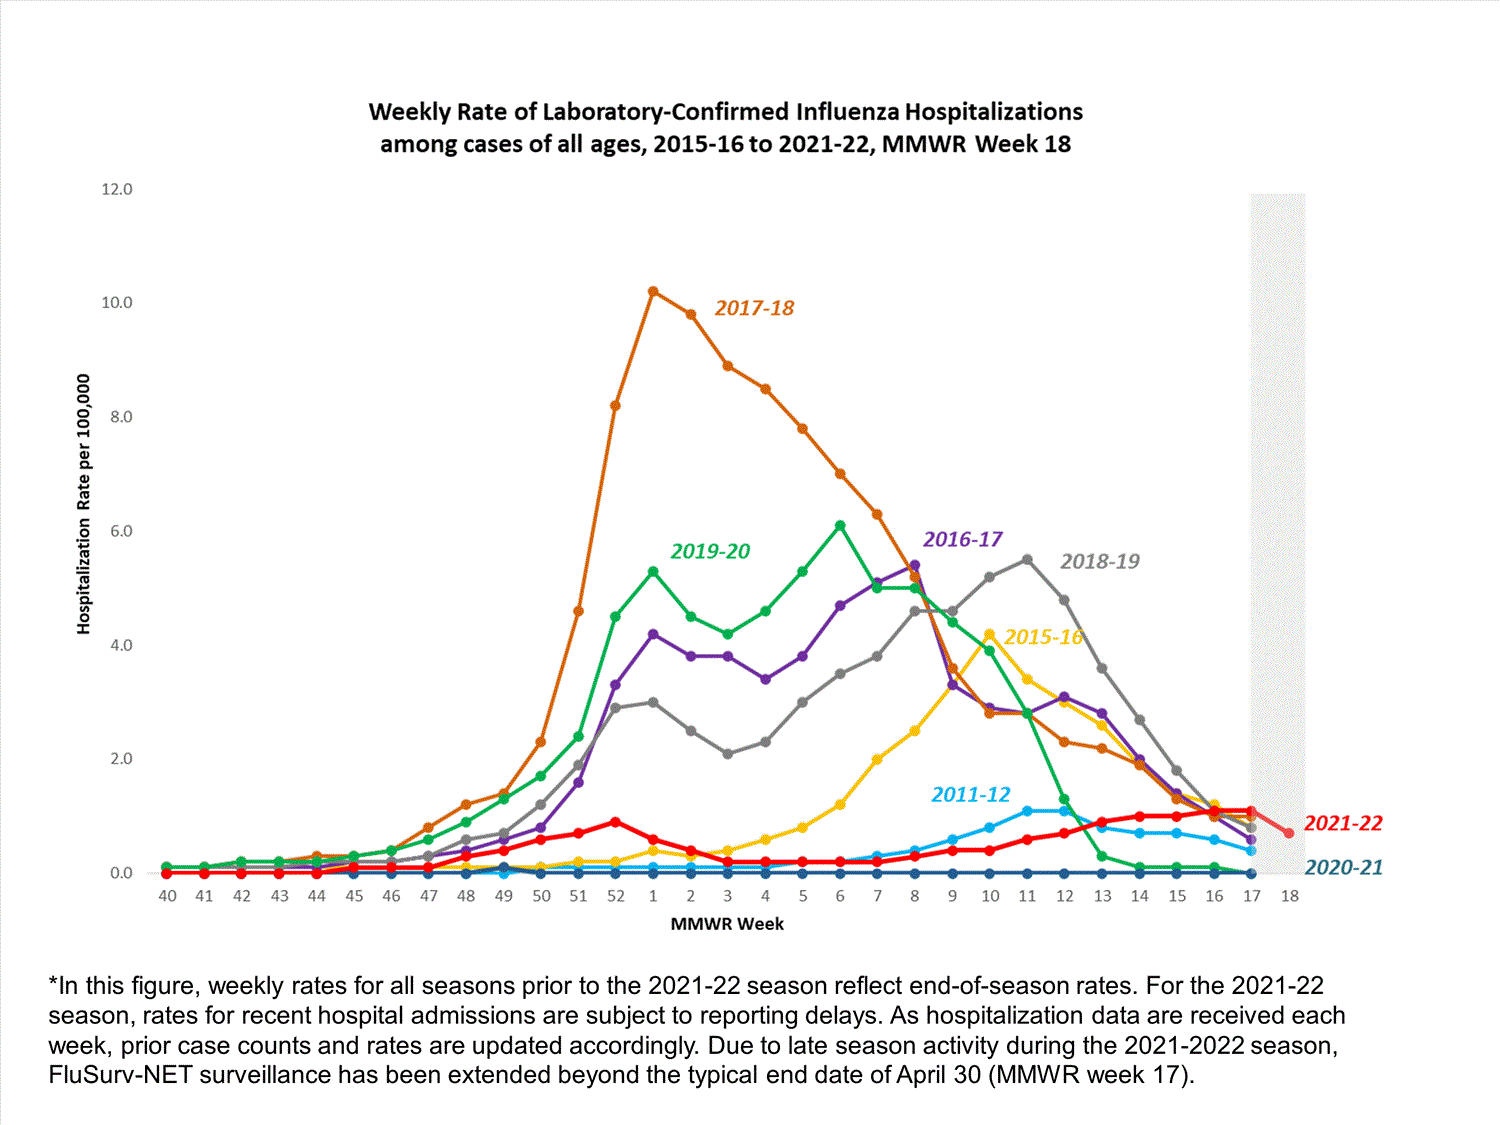
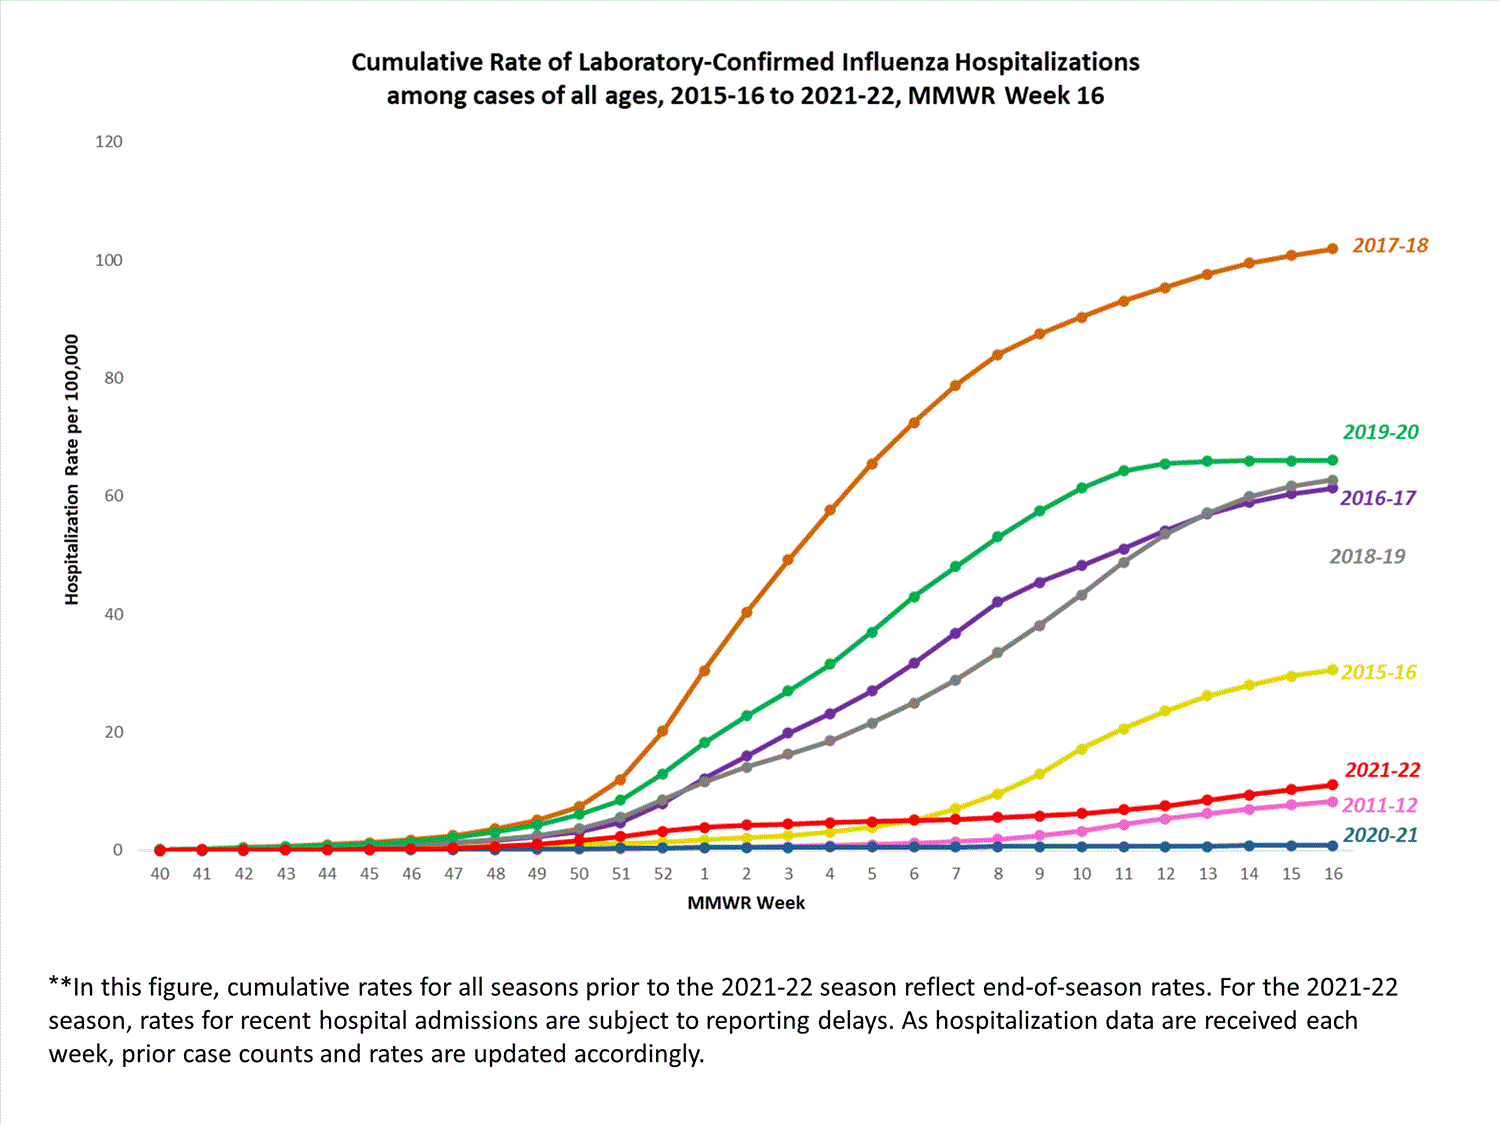
Due to late-season activity during the 2021-2022 season, FluSurv-NET surveillance was extended beyond the typical end date of April 30 (MMWR Week 17) to June 11 (MMWR Week 23). For this reason, comparisons between end of season rates for prior seasons and cumulative hospitalization rates beyond week 17 of the 2021-2022 season should be interpreted with caution and comparisons with similar late-season weekly rates are not possible since similar data from prior seasons is not available.
A total of 5,019 laboratory-confirmed influenza-associated hospitalizations were reported by FluSurv-NET sites between October 1, 2021, and June 11, 2022. The overall cumulative hospitalization rate was 17.1 per 100,000 population and the overall weekly hospitalization rate was 0.3 per 100,000 population. The weekly rate for the 2021-22 season during MMWR week 17 (1.2) was the highest weekly rate observed during the 2021-22 season and the highest rate observed during any week 17 since the 2010-2011 season. While the cumulative hospitalization rate for the 2021-22 season is lower than the end of-season rates observed during the four seasons preceding the COVID-19 pandemic (ranged from 62.0 to 102.9 per 100,000 during the 2016-17 through 2019-20 seasons), recent rates may be underestimated due to reporting delays.
When examining rates by age, the highest rate of hospitalization per 100,000 population was among adults aged 65 and older (49.6). Among adults aged 65 and older, rates were highest among adults aged 85 and older (98.6). Among persons aged less than 65 years, hospitalization rates per 100,000 population were highest among children aged 0-4 years (21.8) followed by adults aged 50-64 years (15.8). When examining rates by race and ethnicity, the highest rate of hospitalization per 100,000 population was among non-Hispanic American Indian or Alaska Native persons (31.4), followed by non-Hispanic Black persons (20.5).
Among 5,019 hospitalizations, 4,843 (96.5%) were associated with influenza A virus, 147 (2.9%) with influenza B virus, 5 (0.1%) with influenza A virus and influenza B virus co-infection, and 24 (0.5%) with influenza virus for which the type was not determined. Among 1153 hospitalizations with influenza A subtype information, 1139 (98.8%) were A(H3N2), and 14 (1.2%) were A(H1N1)pdm09. Based on preliminary data, of the 5,019 laboratory-confirmed influenza-associated hospitalizations, 2.3% also tested positive for SARS-CoV-2.
Among 2,320 hospitalized adults with information on underlying medical conditions, 93.4% had at least one reported underlying medical condition, the most commonly reported were hypertension, cardiovascular disease, metabolic disorder, and obesity. Among 359 hospitalized children with information on underlying medical conditions, 64.6% had at least one reported underlying medical condition; the most commonly reported was asthma.
FluSurv-Net data are used to generate national estimates of the total numbers of influenza cases, medical visits, hospitalizations, and deaths. This season, CDC is reporting preliminary cumulative in-season estimates, which are available at https://www.cdc.gov/flu/about/burden...-estimates.htm
View Full Screen
Additional FluSurv-NET hospitalization surveillance information for current and past seasons and additional age groups:
Surveillance Methods |FluView Interactive: Rates by Age, Sex, and Race/Ethnicity or Data on Patient Characteristics
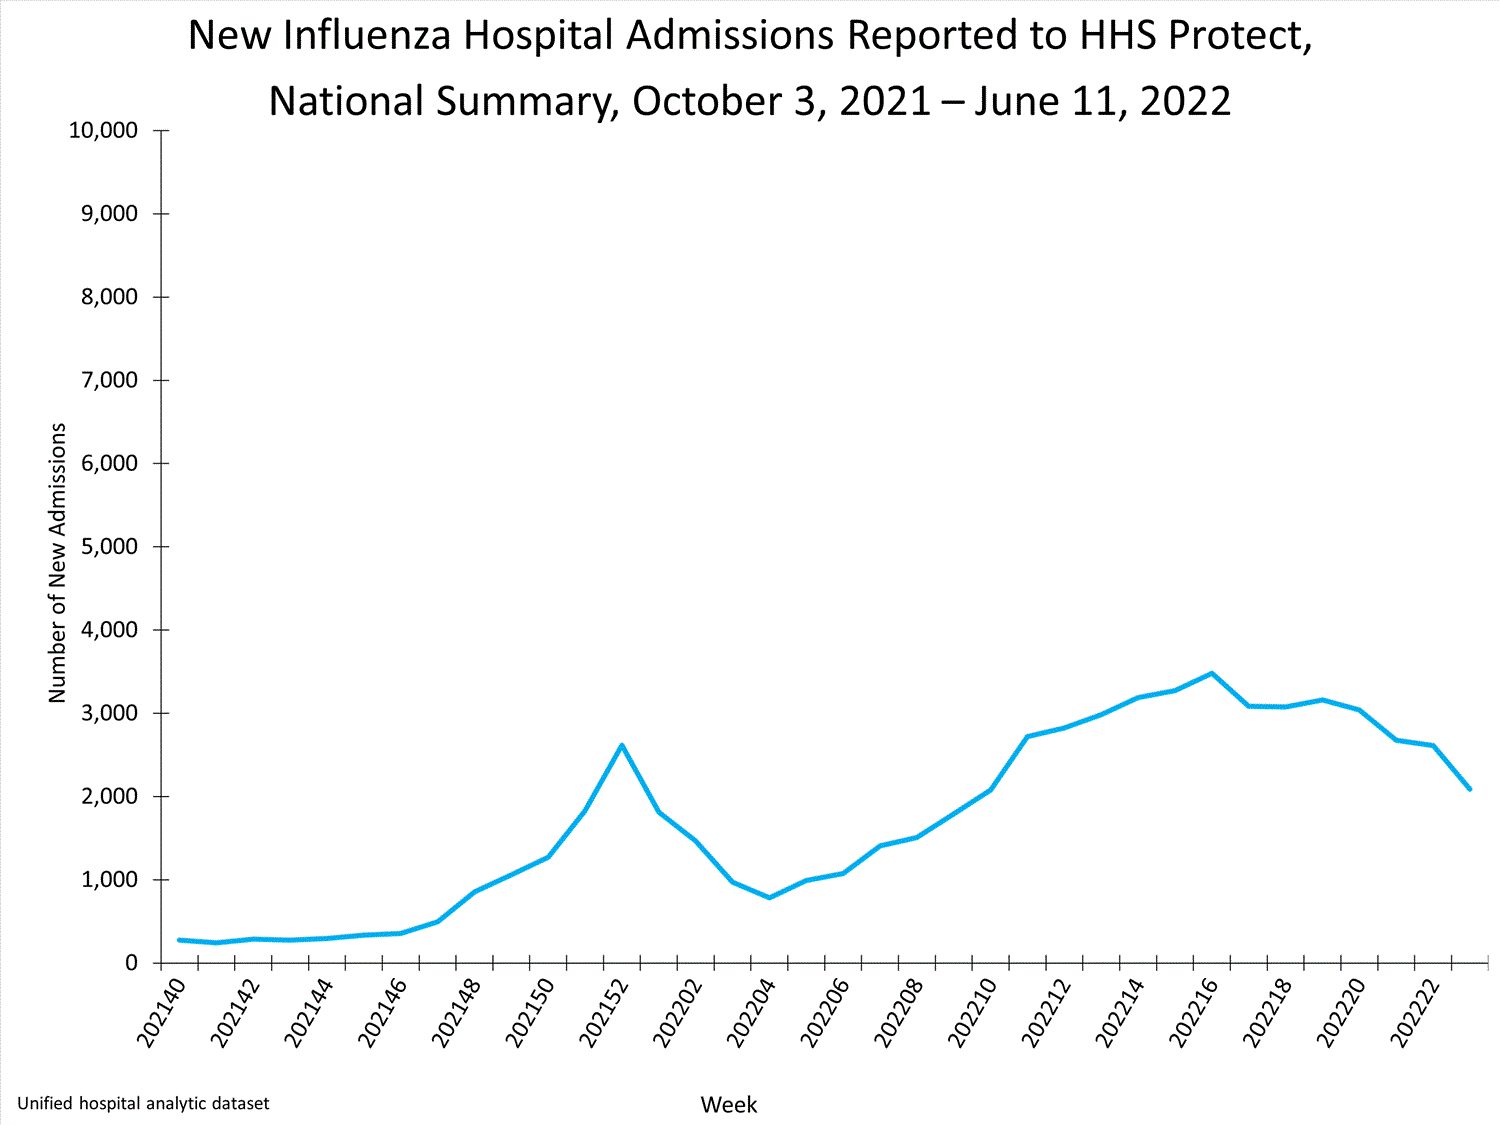
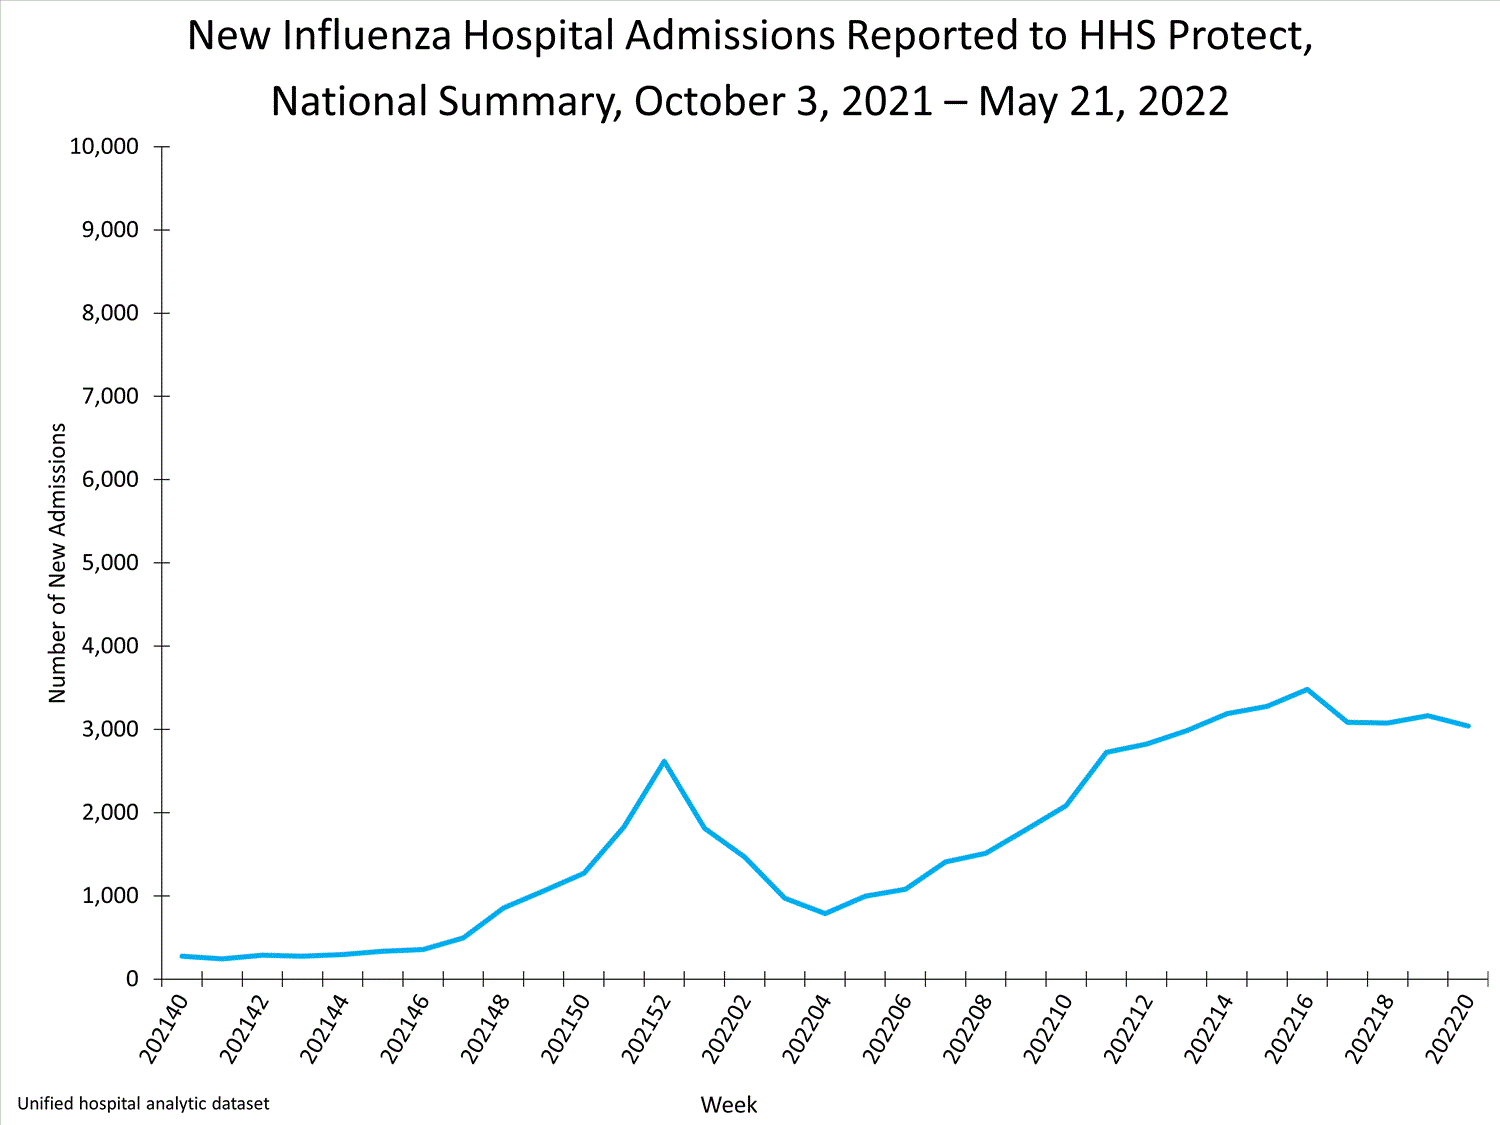
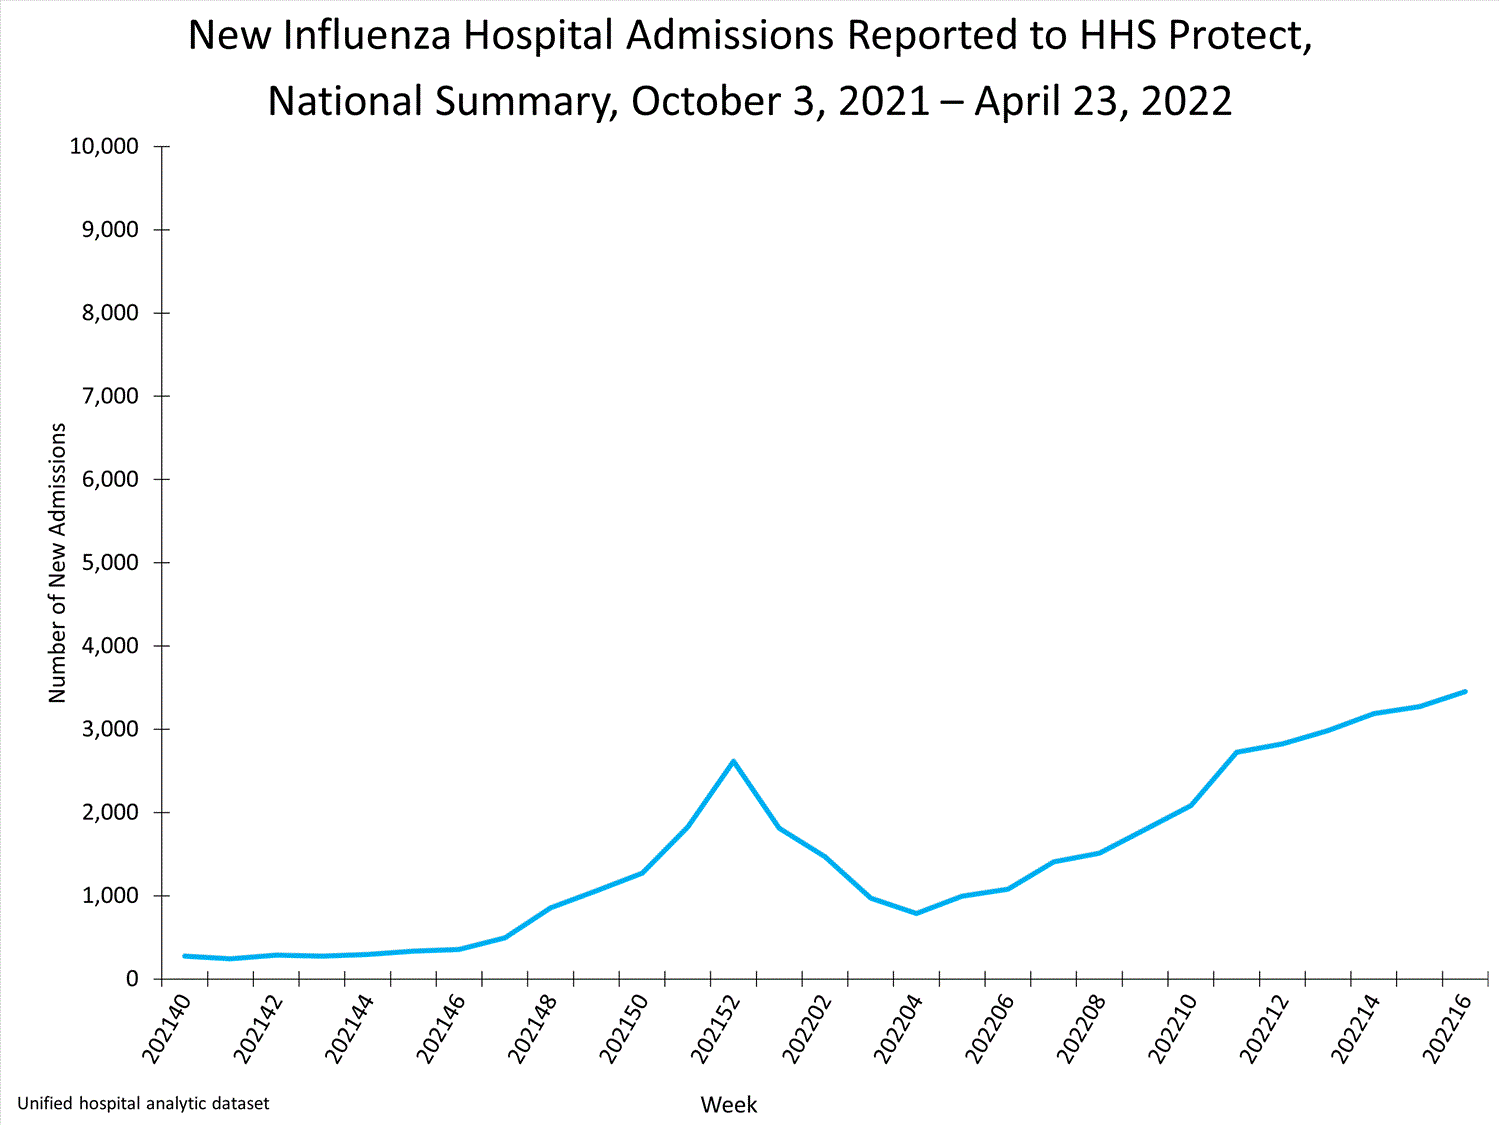
HHS Protect Hospitalization Surveillance
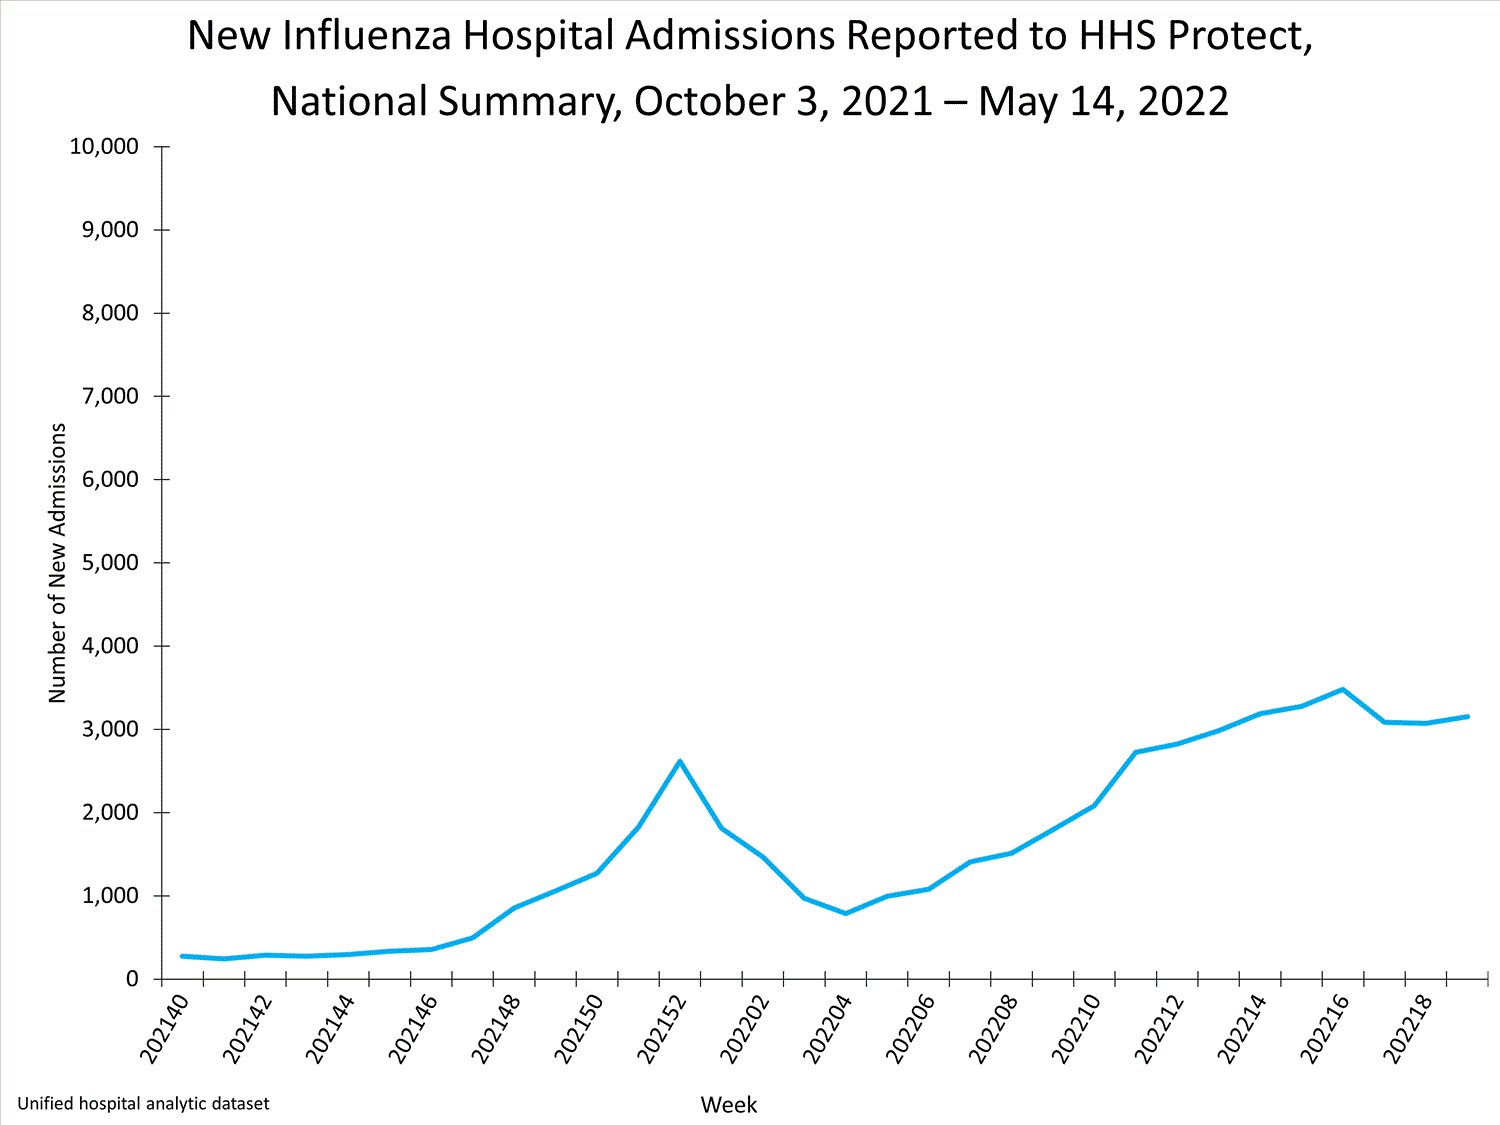
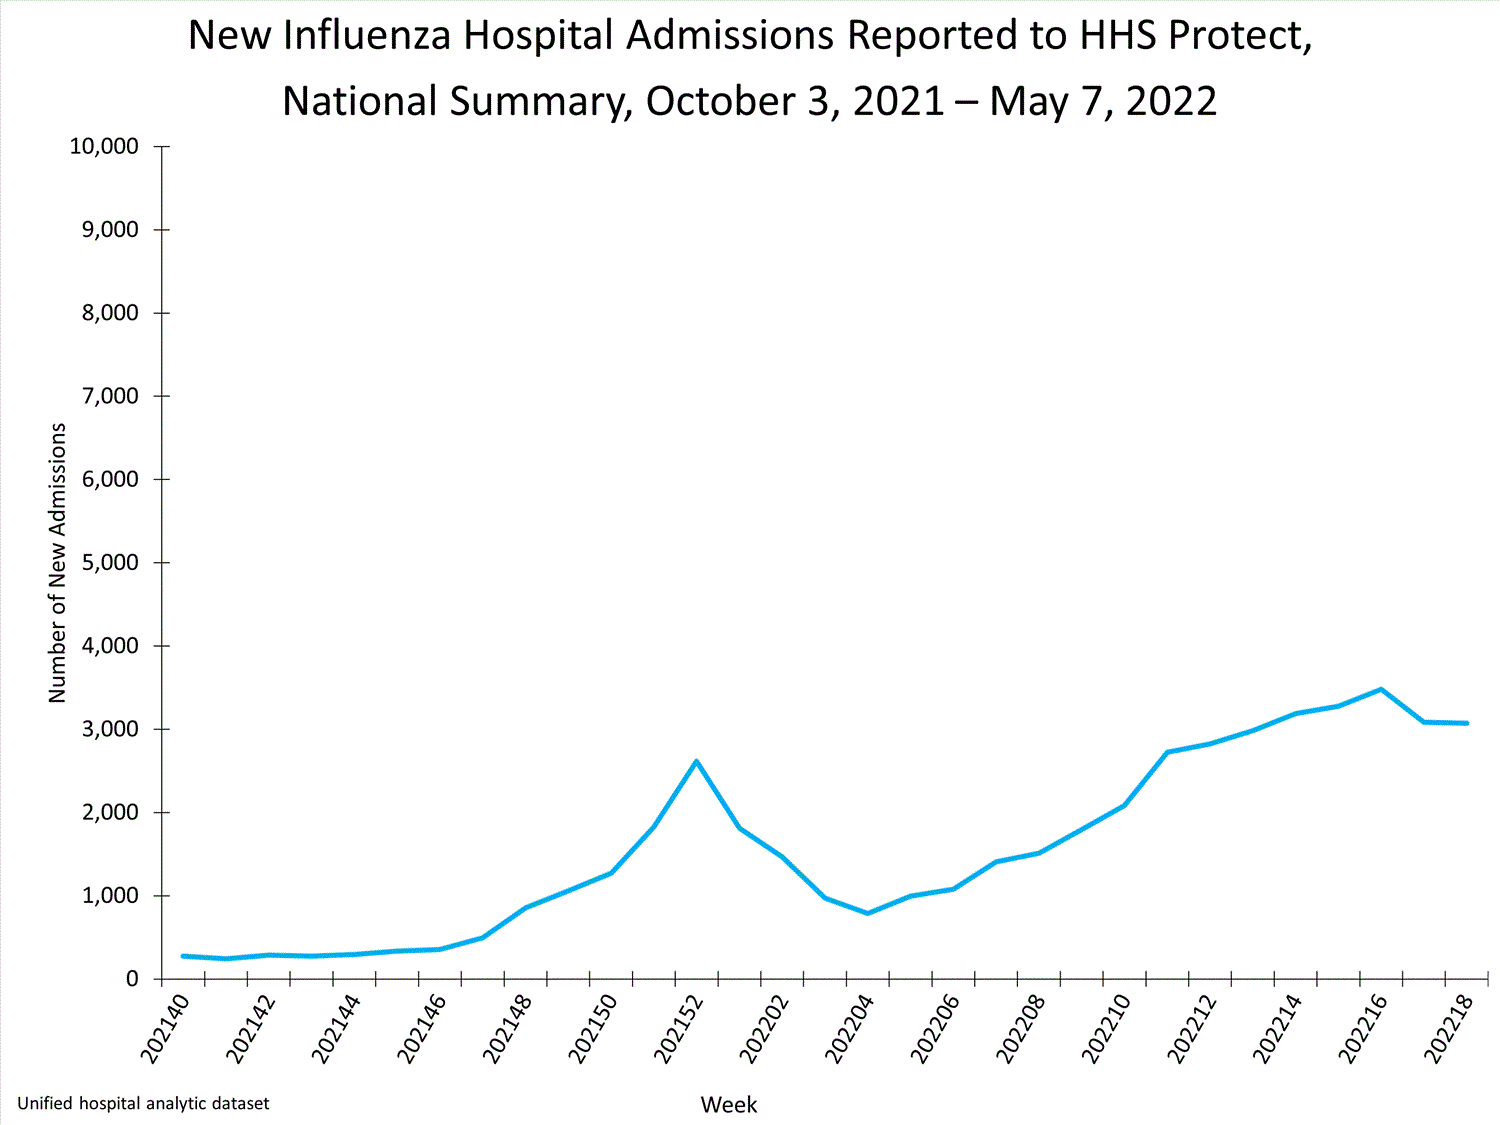
Hospitals report to HHS Protect the number of patients admitted with laboratory-confirmed influenza. During week 23, 2,089 patients with laboratory-confirmed influenza were admitted to the hospital.
Effective February 2, 2022, hospitals are required to report laboratory-confirmed influenza hospitalizations to HHS Protect daily. Prior to this update, reporting influenza hospitalizations was optional. See COVID-19 Guidance for Hospital Reporting and FAQs for additional details on this guidance.
View Chart Data | View Full Screen
Additional HHS Protect hospitalization surveillance information:
Surveillance Methods | Additional Data
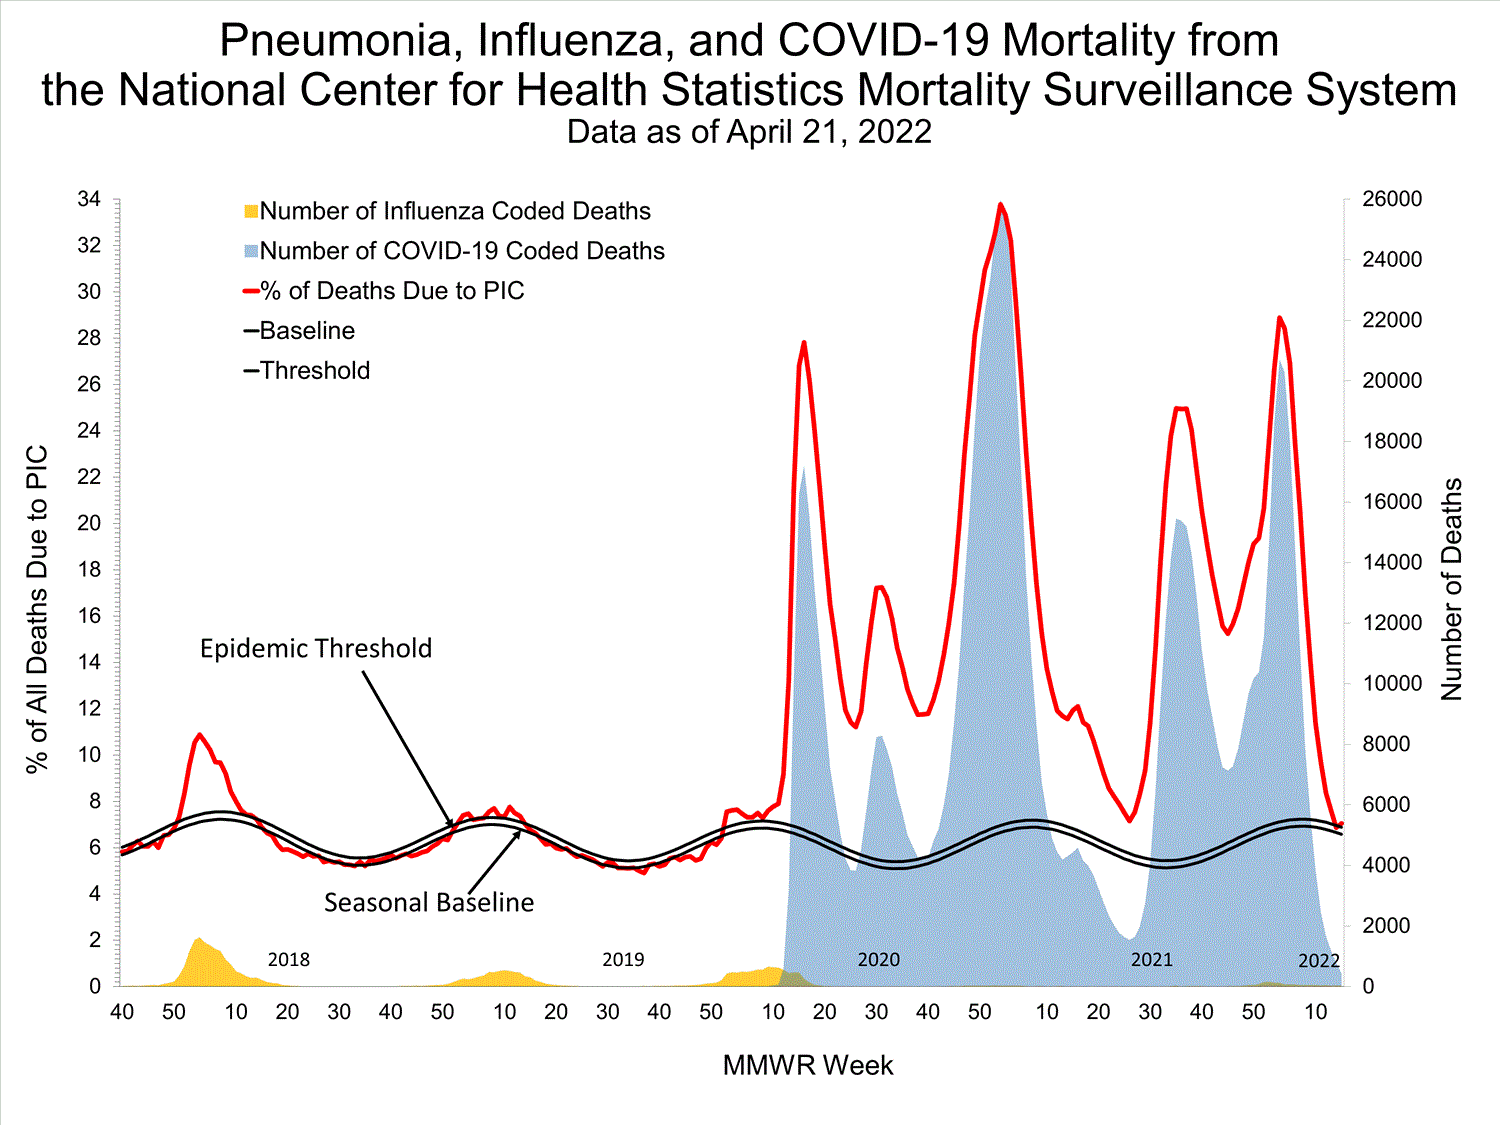
Mortality Surveillance
National Center for Health Statistics (NCHS) Mortality Surveillance
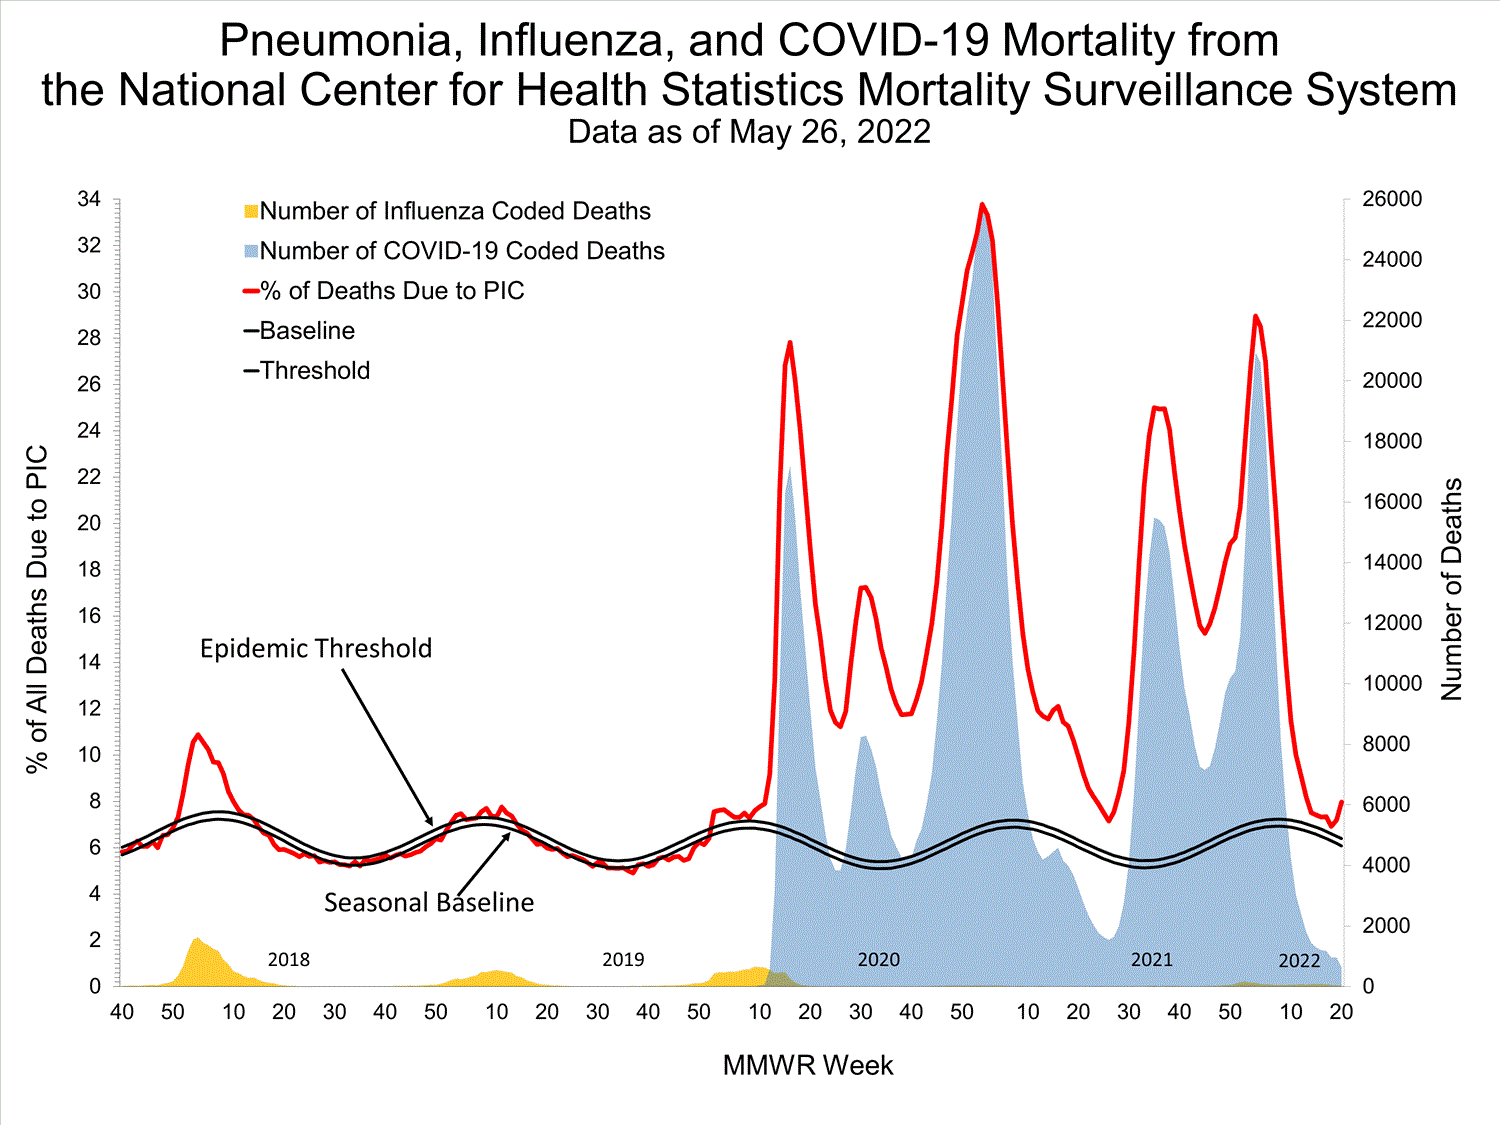
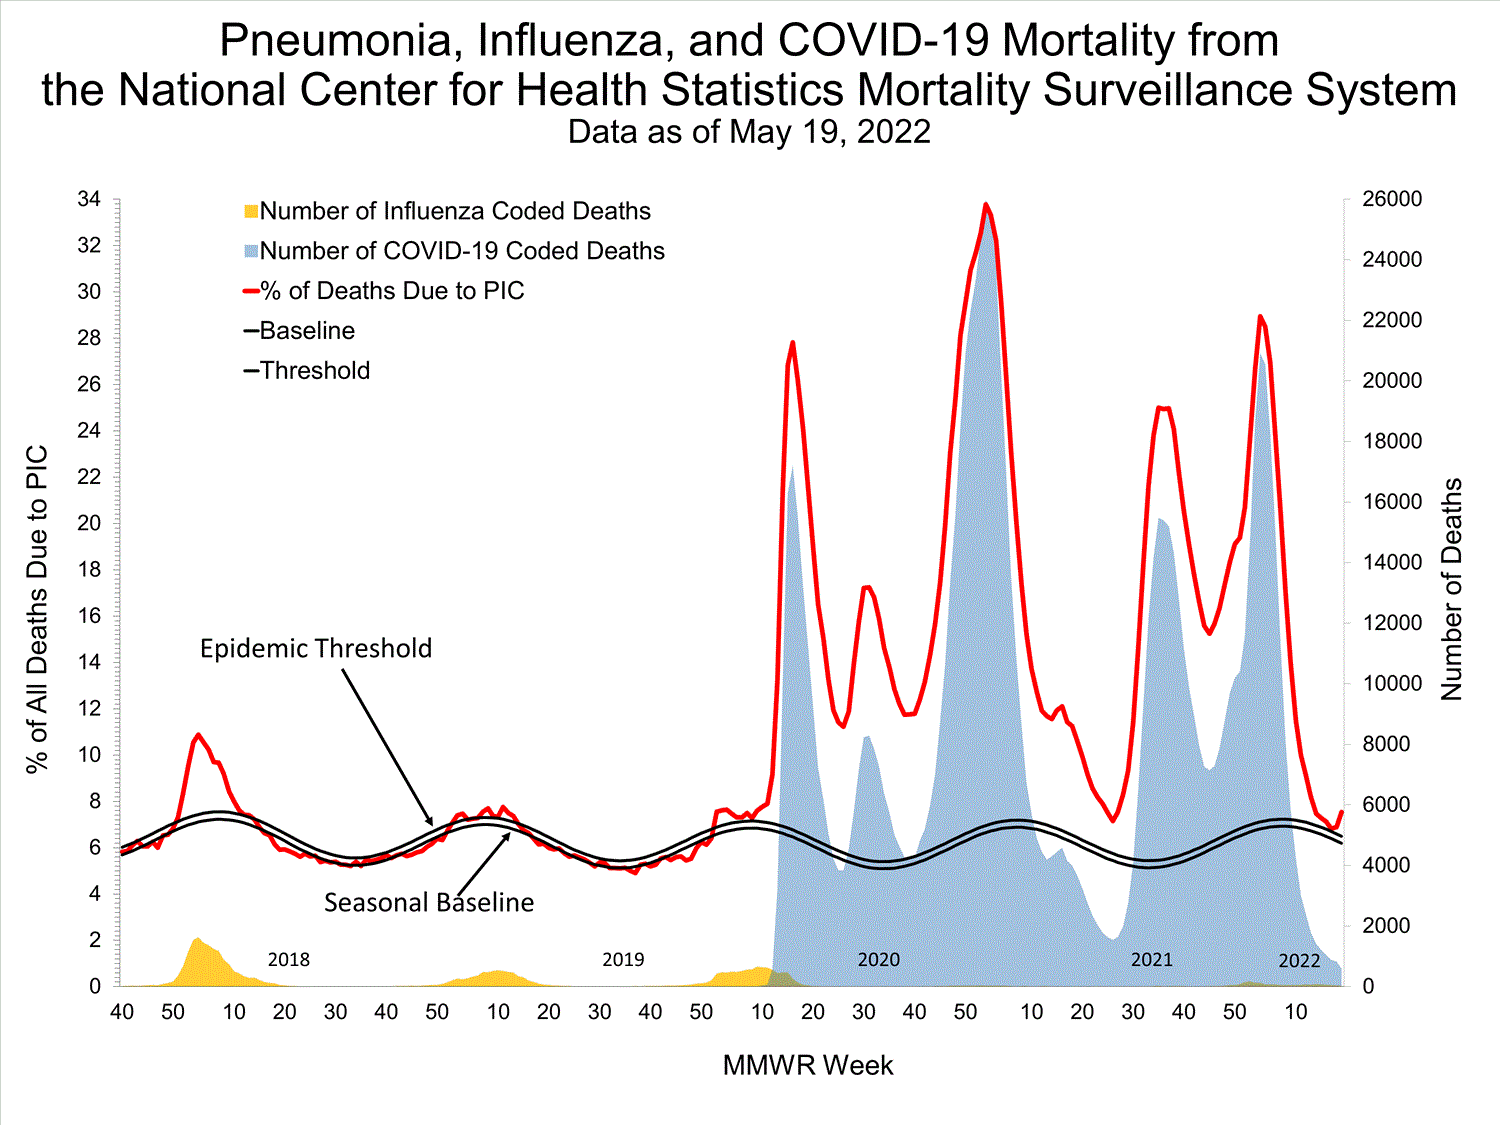
Starting June 6, 2022, the National Vital Statistics System (NVSS) cause of death coding system is undergoing a system-wide upgrade. Because of this upgrade period, certain NVSS surveillance datasets and reports will be paused temporarily, including those used to evaluate pneumonia, influenza, and COVID-19 deaths. NCHS mortality data will not be published in FluView or FluView Interactive for MMWR weeks 22 and 23. Data updates are expected to resume for week 24.
Additional pneumonia, influenza and COVID-19 mortality surveillance information for current and past seasons:
Surveillance Methods | FluView Interactive
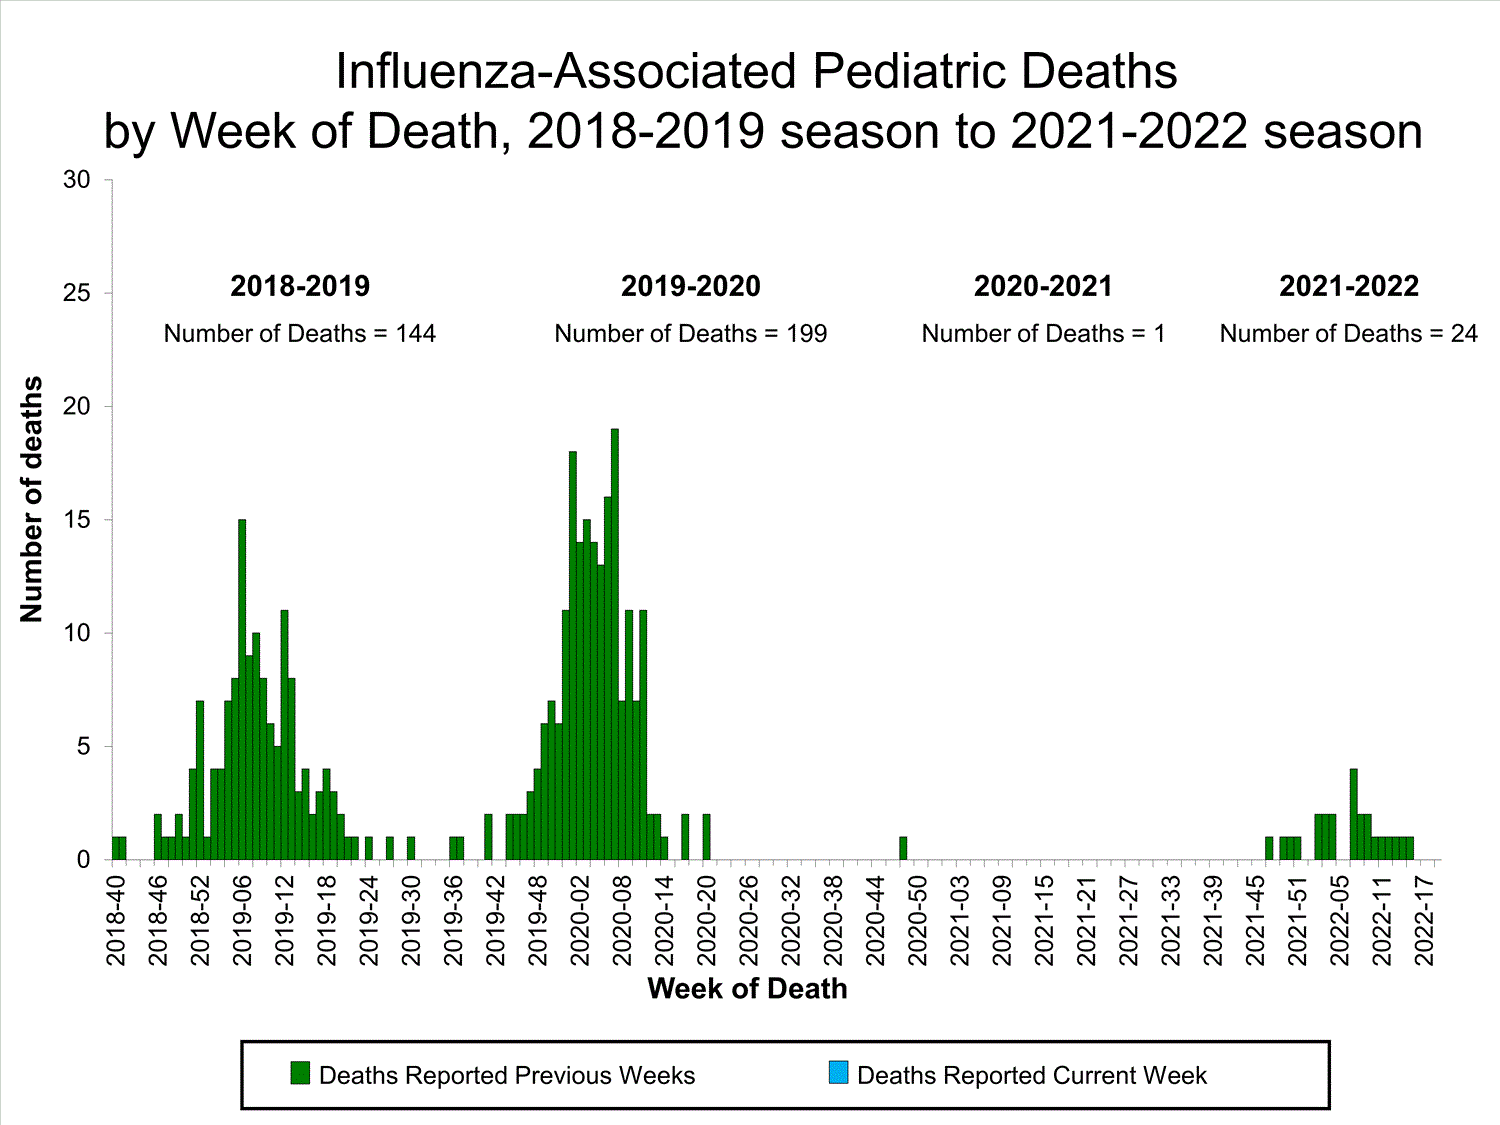
Influenza-Associated Pediatric Mortality
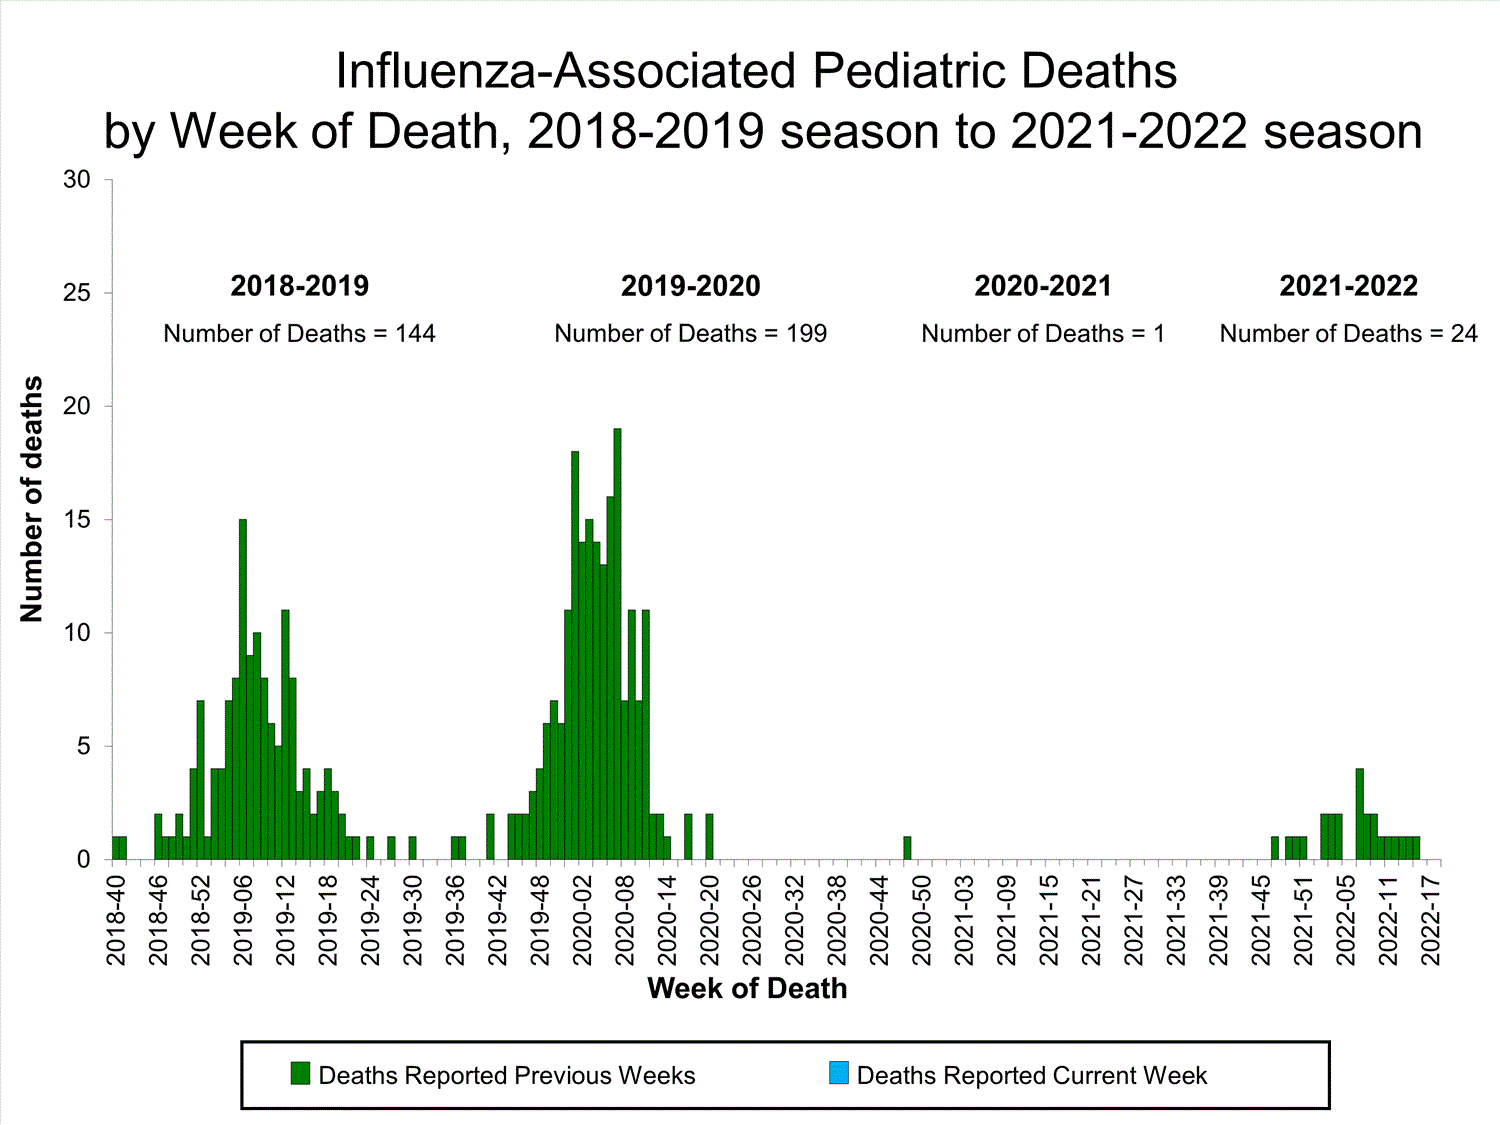
One influenza-associated pediatric death occurring during the 2021-2022 season was reported to CDC during week 23. The death was associated with an influenza A(H3) virus and occurred during week 23.
A total of 29 influenza-associated pediatric deaths occurring during the 2021-2022 season have been reported to CDC.
 View Full Screen
 Additional pediatric mortality surveillance information for current and past seasons:
Surveillance Methods | FluView Interactive
Additional National and International Influenza Surveillance Information
FluView Interactive: FluView includes enhanced web-based interactive applications that can provide dynamic visuals of the influenza data collected and analyzed by CDC. These FluView Interactive applications allow people to create customized, visual interpretations of influenza data, as well as make comparisons across flu seasons, regions, age groups and a variety of other demographics.
National Institute for Occupational Safety and Health: Monthly surveillance data on the prevalence of health-related workplace absenteeism among full-time workers in the United States are available from NIOSH.
U.S. State and local influenza surveillance: Select a jurisdiction below to access the latest local influenza information.
World Health Organization:
Additional influenza surveillance information from participating WHO member nations is available through
FluNet and the Global Epidemiology Reports.
WHO Collaborating Centers for Influenza:
Australia, China, Japan, the United Kingdom, and the United States (CDC in Atlanta, Georgia)
Europe:
The most up-to-date influenza information from Europe is available from WHO/Europe and the European Centre for Disease Prevention and Control.
Public Health Agency of Canada:
The most up-to-date influenza information from Canada is available in Canada’s weekly FluWatch report.
Public Health England:
The most up-to-date influenza information from the United Kingdom is available from Public Health England.
Any links provided to non-Federal organizations are provided solely as a service to our users. These links do not constitute an endorsement of these organizations or their programs by CDC or the Federal Government, and none should be inferred. CDC is not responsible for the content of the individual organization web pages found at these links.
A description of the CDC influenza surveillance system, including methodology and detailed descriptions of each data component is available on the surveillance methods page.


Leave a comment: