 Tweet
Tweet
Weekly U.S. Influenza Surveillance Report
 Note: The COVID-19 pandemic is affecting healthcare seeking behavior. The number of persons and their reasons for seeking care in the outpatient and ED settings is changing. These changes impact data from ILINet in ways that are difficult to differentiate from changes in illness levels, therefore ILINet data should be interpreted with caution. CDC is tracking the COVID-19 pandemic in a weekly publication called COVIDView.
Key Updates for Week 20, ending May 16, 2020
Laboratory confirmed flu activity as reported by clinical laboratories remains low. Influenza-like illness activity continues to decrease and is below the national baseline. The percent of deaths due to pneumonia or influenza (P&I) is decreasing but remains elevated, primarily due to COVID-19, not influenza. Reported pediatric flu deaths for the season are high at 176.
Viruses
Clinical Labs
The percentage of respiratory specimens testing positive for influenza at clinical laboratories is 0.3%. This is similar to the previous week.
Public Health Labs
Nationally, influenza A(H1N1)pdm09 viruses are now the most commonly reported influenza viruses this season.
Virus Characterization
Reporting of genetic and antigenic characterization and antiviral susceptibility of influenza viruses will resume with the 2020-2021 season.
Illness
Outpatient Illness: ILINet
Visits to health care providers for influenza-like illness (ILI) decreased from 1.2% last week to 1.1% this week. ILI is below baseline nationally and for all regions.
Outpatient Illness: ILINet Activity Map
Similar to last week, one jurisdiction experienced high ILI activity this week.
Geographic Spread
No jurisdictions reported regional or widespread influenza activity this week.
Severe Disease
Hospitalizations
The overall cumulative hospitalization rate for the season increased to 69.4 per 100,000.
P&I Mortality
The percentage of deaths attributed to pneumonia and influenza is 7.3%, down from 10.5% last week, but above the epidemic threshold of 6.5%.
Pediatric Deaths
Two influenza-associated pediatric deaths occurring during the 2019-2020 season were reported this week. The total for the season is 176.
All data are preliminary and may change as more reports are received.
A description of the CDC influenza surveillance system, including methodology and detailed descriptions of each data component is available on the surveillance methods page.
Additional information on the current and previous influenza seasons for each surveillance component are available on FluView Interactive.
Key Points
- Nationally, influenza activity remains low.
- CDC will continue to track influenza activity year-round as always, but as flu activity remains low, an abbreviated FluView will be published weekly during the remainder of the 2019-2020 season.
- More detailed interpretation of data and more COVID-19 specific information can be found in COVIDView
U.S. Virologic Surveillance
Clinical Laboratories
The results of tests performed by clinical laboratories nationwide are summarized below. Data from clinical laboratories (the percentage of specimens tested that are positive for influenza) are used to monitor whether influenza activity is increasing or decreasing.
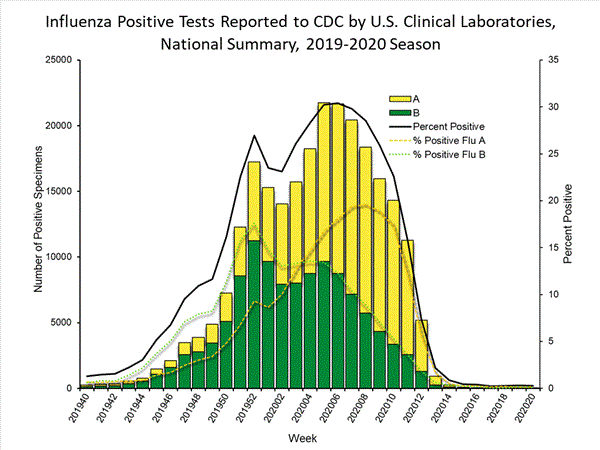
View Chart Data | View Full ScreenPublic Health Laboratories
The results of tests performed by public health laboratories nationwide are summarized below. Data from public health laboratories are used to monitor the proportion of circulating viruses that belong to each influenza subtype/lineage.
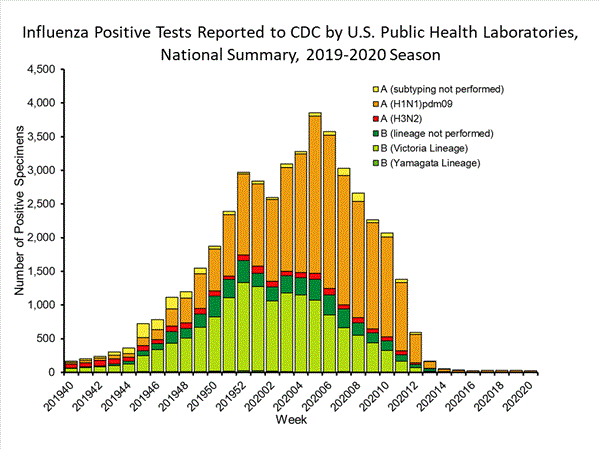
View Chart Data | View Full Screen
Additional virologic surveillance information for current and past seasons:
Surveillance Methods | FluView Interactive: National, Regional, and State Data or Age Data
Outpatient Illness Surveillance
ILINet
Nationwide during week 20, 1.1% of patient visits reported through the U.S. Outpatient Influenza-like Illness Surveillance Network (ILINet) were due to influenza-like illness (ILI). This percentage is below the national baseline of 2.4%.
View Chart Data (current season only) | View Full Screen
On a regional level, the percentage of outpatient visits for ILI ranged from 0.6% to 1.8% during week 20. Compared to last week, the percent of outpatient visits for ILI increased slightly in region 5, remained constant in regions 4, 7, and 10, and decreased in all other regions. All regions reported a percentage of outpatient visits for ILI below their region-specific baselines.
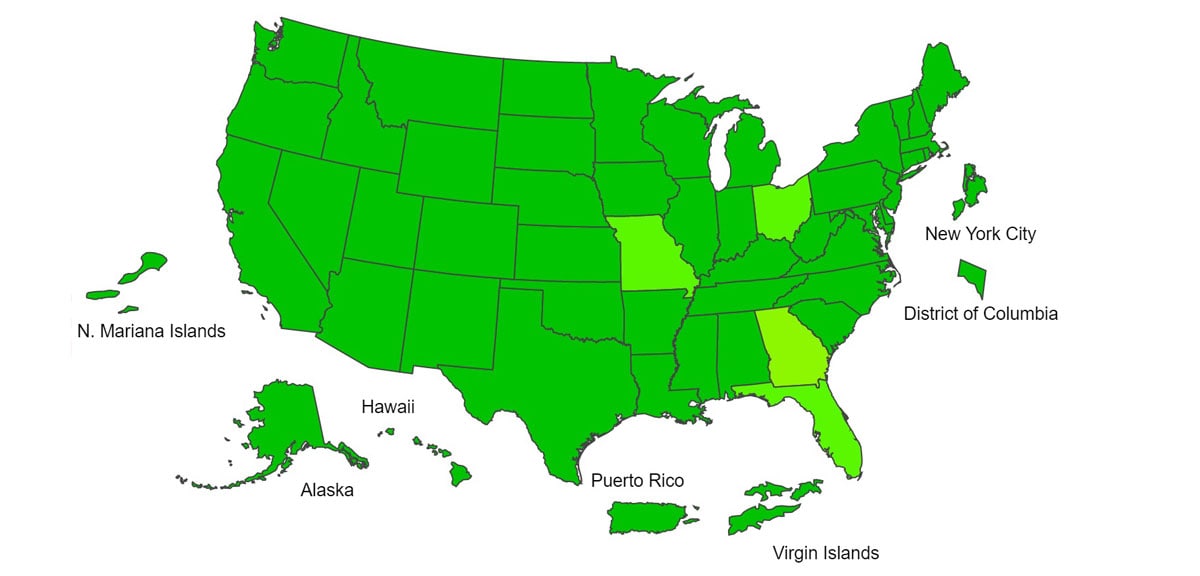
ILI Activity Map
Data collected in ILINet are used to produce a measure of ILI activity* by state.
During week 20, the following ILI activity levels were experienced:
- High – one state (Wisconsin)
- Moderate – Puerto Rico and one state (Idaho)
- Low – District of Columbia and one state (Maryland)
- Minimal - New York City, and 47 states (Alabama, Alaska, Arizona, Arkansas, California, Colorado, Connecticut, Delaware, Florida, Georgia, Hawaii, Illinois, Indiana, Iowa, Kansas, Kentucky, Louisiana, Maine, Massachusetts, Michigan, Minnesota, Mississippi, Missouri, Montana, Nebraska, Nevada, New Hampshire, New Jersey, New Mexico, New York, North Carolina, North Dakota, Ohio, Oklahoma, Oregon, Pennsylvania, Rhode Island, South Carolina, South Dakota, Tennessee, Texas, Utah, Vermont, Virginia, Washington, West Virginia, and Wyoming)
- Data were insufficient to calculate an ILI activity level from the U.S. Virgin Islands.
*Data collected in ILINet may disproportionally represent certain populations within a state, and therefore, may not accurately depict the full picture of influenza activity for the whole state. Differences in the data presented here by CDC and independently by some state health departments likely represent differing levels of data completeness with data presented by the state likely being the more complete.
Additional information about medically attended visits for ILI for current and past seasons:
Surveillance Methods | FluView Interactive: National, Regional, and State Data or ILI Activity Map
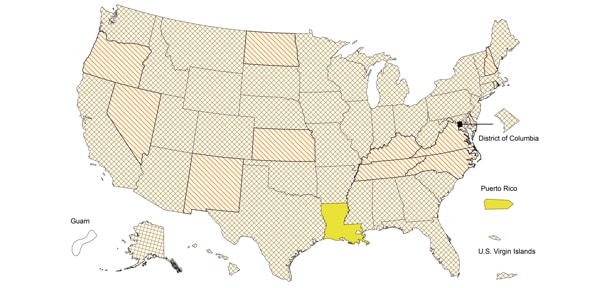
Geographic Spread of Influenza as Assessed by State and Territorial Epidemiologists
The influenza activity reported by state and territorial epidemiologists indicates geographic spread of influenza viruses but does not measure the severity of influenza activity.
During week 20, the following influenza activity was reported:
- Local – Puerto Rico and one state (Louisiana)
- Sporadic – the District of Columbia, the U.S. Virgin Islands and 37 states (Alabama, Alaska, Arizona, Arkansas, California, Colorado, Connecticut, Florida, Georgia, Hawaii, Idaho, Illinois, Indiana, Iowa, Maine, Maryland, Massachusetts, Michigan, Minnesota, Mississippi, Missouri, Montana, Nebraska, New Jersey, New York, Ohio, Oklahoma, Pennsylvania, South Carolina, South Dakota, Texas, Utah, Vermont, Washington, West Virginia, Wisconsin and Wyoming)
- No Activity – 12 states (Delaware, Kansas, Kentucky, Nevada, New Hampshire, New Mexico, North Carolina, North Dakota, Oregon, Rhode Island, Tennessee and Virginia)
- Guam did not report.
Additional geographic spread surveillance information for current and past seasons:
Surveillance Methods | FluView Interactive
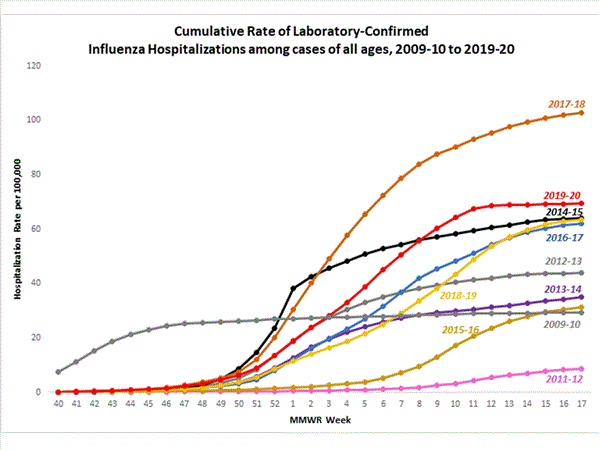
Influenza-Associated Hospitalizations
The Influenza Hospitalization Surveillance Network (FluSurv-NET) conducts population-based surveillance for laboratory-confirmed influenza-related hospitalizations in select counties in the Emerging Infections Program (EIP) states and Influenza Hospitalization Surveillance Project (IHSP) states.
As in previous seasons, patients admitted for laboratory-confirmed influenza-related hospitalization after April 30, 2020 will not be included in FluSurv-NET. Data on patients admitted through April 30, 2020 will continue to be updated as additional information is received.
A total of 20,144 laboratory-confirmed influenza-associated hospitalizations were reported by FluSurv-NET sites between October 1, 2019 and April 30, 2020 with a cumulative hospitalization rate of 69.4 per 100,000 population.
View Full Screen
View Full Screen
Additional hospitalization surveillance information for current and past seasons and additional age groups:
Surveillance Methods | FluView Interactive: Rates by Age or Patient Characteristics
Pneumonia and Influenza (P&I) Mortality Surveillance
Based on National Center for Health Statistics (NCHS) mortality surveillance data available on May 21, 2020, 7.3% of the deaths occurring during the week ending May 16, 2020 (week 20) were due to P&I. This percentage is above the epidemic threshold of 6.5% for week 20.
Weekly mortality surveillance data include a combination of machine coded and manually coded causes of death collected from death certificates. Percentages of deaths due to pneumonia and influenza (P&I) are higher among manually coded records than more rapidly available machine coded records. Due to the additional time needed for manual coding, the initially reported P&I percentages may increase as more data are received and processed.
View Chart Data | View Full Screen
Additional pneumonia and influenza mortality surveillance information for current and past seasons:
Surveillance Methods | FluView Interactive
Influenza-Associated Pediatric Mortality
Two influenza-associated pediatric deaths occurring during the 2019-2020 season were reported to CDC during week 20. One was associated with an influenza A virus with no subtyping performed and occurred during week 20 (the week ending May 16, 2020). One was associated with an influenza B virus with no lineage determined and occurred during week 9 (the week ending February 29, 2020).
A total of 176 influenza-associated pediatric deaths occurring during the 2019-2020 season have been reported to CDC.
View Full Screen
Additional pediatric mortality surveillance information for current and past seasons:
Surveillance Methods | FluView Interactive
Additional National and International Influenza Surveillance Information
FluView Interactive: FluView includes enhanced web-based interactive applications that can provide dynamic visuals of the influenza data collected and analyzed by CDC. These FluView Interactive applications allow people to create customized, visual interpretations of influenza data, as well as make comparisons across flu seasons, regions, age groups and a variety of other demographics. To access these tools, visit http://www.cdc.gov/flu/weekly/fluviewinteractive.htm
National Institute for Occupational Safety and Health: Monthly surveillance data on the prevalence of health-related workplace absenteeism among full-time workers in the United States are available from NIOSH at https://www.cdc.gov/niosh/topics/absences/default.html
U.S. State and local influenza surveillance:Select a jurisdiction below to access the latest local influenza information
World Health Organization: Additional influenza surveillance information from participating WHO member nations is available through FluNet and the Global Epidemiology Reports.
WHO Collaborating Centers for Influenza located in Australia, China, Japan, the United Kingdom, and the United States (CDC in Atlanta, Georgia).
Europe: For the most recent influenza surveillance information from Europe, please see WHO/Europe and the European Centre for Disease Prevention and Control at http://www.flunewseurope.org/.
Public Health Agency of Canada: The most up-to-date influenza information from Canada is available at http://www.phac-aspc.gc.ca/fluwatch/
Public Health England: The most up-to-date influenza information from the United Kingdom is available at https://www.gov.uk/government/statistics/weekly-national-flu-reports
Any links provided to non-Federal organizations are provided solely as a service to our users. These links do not constitute an endorsement of these organizations or their programs by CDC or the Federal Government, and none should be inferred. CDC is not responsible for the content of the individual organization web pages found at these links.
An overview of the CDC influenza surveillance system, including methodology and detailed descriptions of each data component, is available at: http://www.cdc.gov/flu/weekly/overview.htm.
--------------------------------------------------------------------------------
Page last reviewed: May 22, 2020, 11:00 AMContent source: Centers for Disease Control and Prevention, National Center for Immunization and Respiratory Diseases (NCIRD)

Comment