Announcement

Collapse
No announcement yet.

2018-19 USA Influenza & Pneumonia Mortality Surveillance Data from the National Center for Health Statistics Mortality Surveillance System

Collapse
X
 
  • Filter
  • Time
  • Show
Clear All
new posts

  • #16
    Influenza deaths
    Week 40: 10
    Week 41: 12
    Week 42: 18
    Week 43: 24
    Week 44: 24
    Week 45: 29
    Week 46: 25
    Week 47: 31
    Week 48: 35
    Week 49: 54
    Week 50: 48
    Week 51: 83
    Week 52: 112
    Week 1: 172
    Week 2: 212
    Week 3: 177
    Week 4: 158
    Total: 1,224

    Pneumonia deaths
    Week 40: 2,933
    Week 41: 2,817
    Week 42: 2,953
    Week 43: 3,032
    Week 44: 2,949
    Week 45: 2,931
    Week 46: 3,058
    Week 47: 3,080
    Week 48: 3,159
    Week 49: 3,210
    Week 50: 3,321
    Week 51: 3,154
    Week 52: 3,154
    Week 1: 3,254
    Week 2: 3,153
    Week 3: 3,007
    Week 4: 2,298
    Total: 51,463


    Comparison of influenza death certificates Weeks 40 - 4 with corresponding period from previous years (note figures for 2018-19 are preliminary and are likely to increase)
    2018-19: 1,224
    2017-18: 7,426
    2016-17: 1,878
    2015-16: 377
    2014-15: 5,028
    2013-14: 2,294
    2012-13: 2,833

    Click image for larger version

Name:	Influenza Mortality.png
Views:	188
Size:	34.4 KB
ID:	807179
    Twitter: @RonanKelly13
    The views expressed are mine alone and do not represent the views of my employer or any other person or organization.

    Comment


    • #17
      Influenza deaths
      Week 40: 10
      Week 41: 12
      Week 42: 18
      Week 43: 24
      Week 44: 24
      Week 45: 29
      Week 46: 25
      Week 47: 31
      Week 48: 35
      Week 49: 54
      Week 50: 48
      Week 51: 84
      Week 52: 122
      Week 1: 177
      Week 2: 217
      Week 3: 194
      Week 4: 191
      Week 5: 182
      Total: 1,477

      Pneumonia deaths
      Week 40: 2,941
      Week 41: 2,844
      Week 42: 2,953
      Week 43: 3,034
      Week 44: 2,953
      Week 45: 2,934
      Week 46: 3,062
      Week 47: 3,089
      Week 48: 3,177
      Week 49: 3,226
      Week 50: 3,353
      Week 51: 3,239
      Week 52: 3,302
      Week 1: 3,339
      Week 2: 3,255
      Week 3: 3,228
      Week 4: 2,794
      Week 5: 2,367
      Total: 55,090


      Comparison of influenza death certificates Weeks 40 - 5 with corresponding period from previous years (note figures for 2018-19 are preliminary and are likely to increase)
      2018-19: 1,477
      2017-18: 8,782
      2016-17: 2,229
      2015-16: 438
      2014-15: 5,611
      2013-14: 2,679
      2012-13: 3,225

      Click image for larger version

Name:	Influenza Mortality.png
Views:	286
Size:	34.7 KB
ID:	807591

      Twitter: @RonanKelly13
      The views expressed are mine alone and do not represent the views of my employer or any other person or organization.

      Comment


      • #18
        2018-2019 U.S. Flu Season: Preliminary Burden Estimates


        Language: English (US)
        Click image for larger version

Name:	Untitled.png
Views:	181
Size:	51.1 KB
ID:	807635

        *These estimates are preliminary and based on data from CDC’s weekly influenza surveillance reports summarizing key influenza activity indicators.
        On This Page


        This web page provides weekly preliminary estimates of the cumulative in-season numbers of flu illnesses, medical visits and hospitalizations in the United States. CDC has estimated the burden of flu since 2010 using a mathematical model that is based on observed rates of laboratory-confirmed influenza-associated hospitalizations collected through a surveillance network that covers approximately 8.5% of the U.S. population (~27 million people). Estimates of flu-related deaths will be provided at a later time, when there is sufficient data to support a more precise estimate for that outcome.
        The 2018-2019 flu season is the first season CDC has reported in-season burden estimates of flu in the U.S. These in-season estimates will be updated over the course of the flu season.


        Limitations

        The estimates of the cumulative burden of seasonal influenza are subject to several limitations.
        First, the cumulative rate of laboratory-confirmed influenza-associated hospitalizations reported during the season may be an under-estimate of the rate at the end of the season because of identification and reporting delays.
        Second, rates of laboratory-confirmed influenza-associated hospitalizations were adjusted for the frequency of influenza testing and the sensitivity of influenza diagnostic assays. However, data on testing practices during the 2018-2019 season are not available in real-time. CDC used data on testing practices from the 2014-2015 influenza season as a proxy. Burden estimates will be updated at a later date when data on contemporary testing practices become available.
        Third, estimates of influenza-associated illness and medical visits are based on data from prior seasons, which may not be accurate if the seriousness of illness or patterns of care-seeking have changed.
        Frequently Asked Questions

        What does the cumulative burden of influenza for the 2018-2019 season mean?

        The cumulative burden of influenza is an estimate of the number of people who have been sick, seen a healthcare provider, been hospitalized, or died as a result of influenza since October 01, 2018. CDC does not know the exact number of people who have been sick and affected by influenza because influenza is not a reportable disease in most areas of the United States. However, these numbers are estimated using a mathematical model, based on observed rates of laboratory-confirmed influenza-associated hospitalizations.
        How does CDC estimate the cumulative burden of seasonal influenza?

        Preliminary estimates of the cumulative burden of seasonal influenza during the 2018-2019 season in the United States are based on crude rates of laboratory-confirmed influenza-associated hospitalizations, reported through the Influenza Hospitalization Surveillance Network (FluSurv-NET), which were adjusted for the frequency of influenza testing during recent prior seasons and the sensitivity of influenza diagnostic assays. Rates of hospitalization were then multiplied by previously estimated ratio of hospitalizations to symptomatic illnesses, and frequency of seeking medical care to calculate symptomatic illnesses, medical visits, and deaths associated with seasonal influenza, respectively.
        Why does the estimate of cumulative burden change each week?

        The estimates of cumulative burden of seasonal influenza are considered preliminary and may change each week as new laboratory-confirmed influenza-associated hospitalizations are reported to CDC. New reports include both new admissions that have occurred during the reporting week and also patients admitted in previous weeks that have been newly reported to CDC.
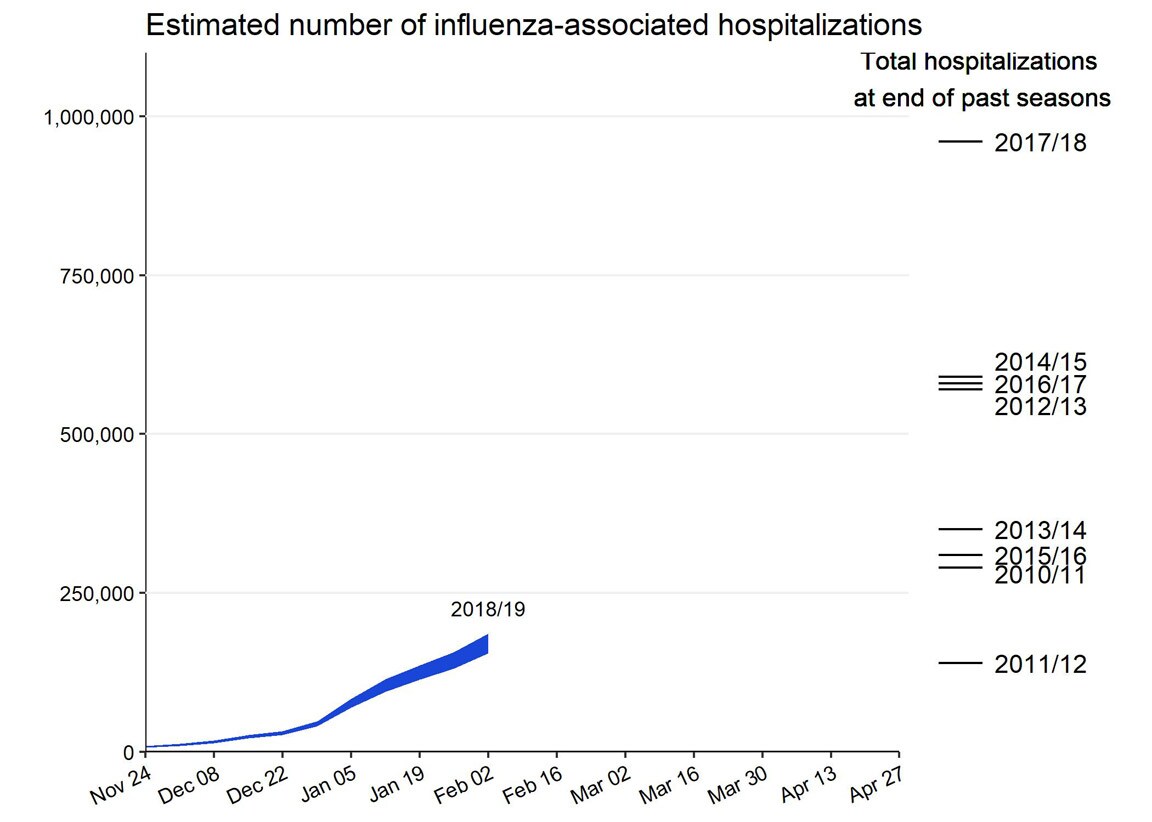
        How does the number of flu hospitalizations estimated so far this season compare with previous end-of-season hospitalization estimates?

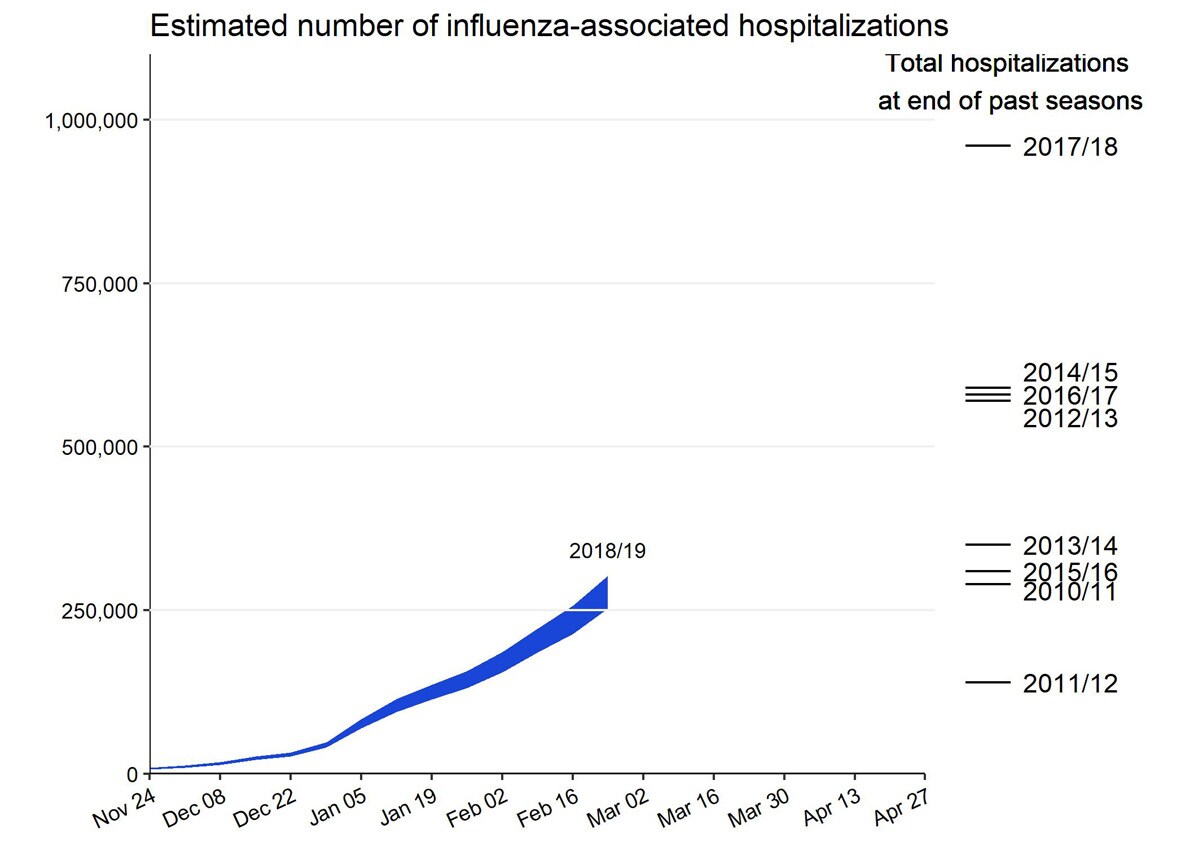
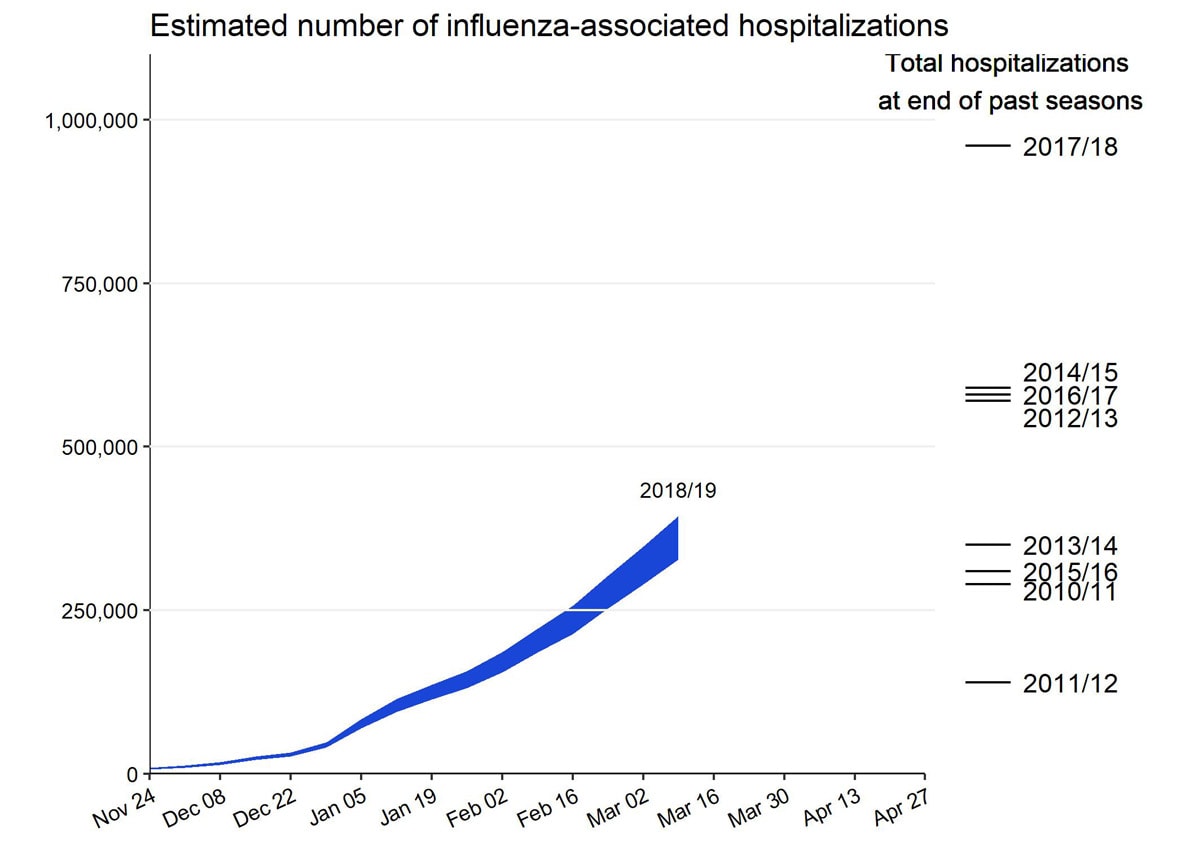
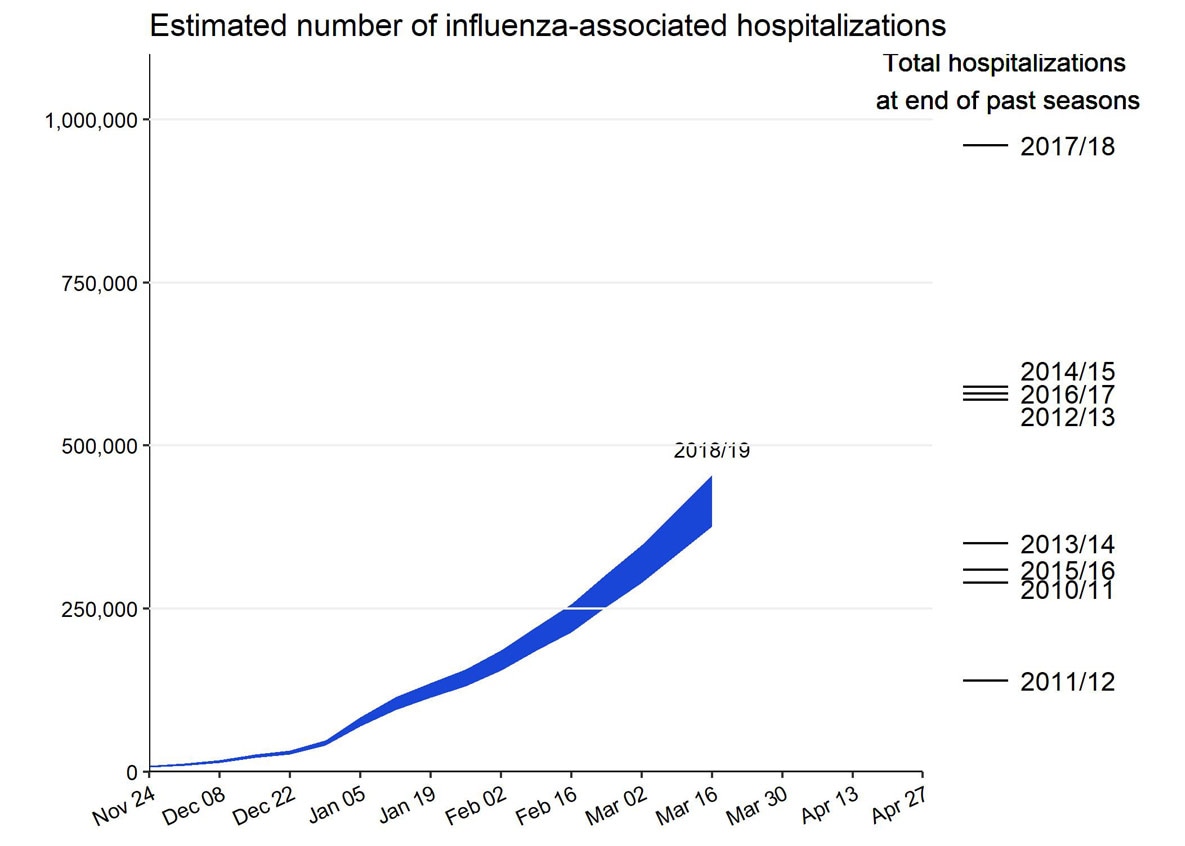
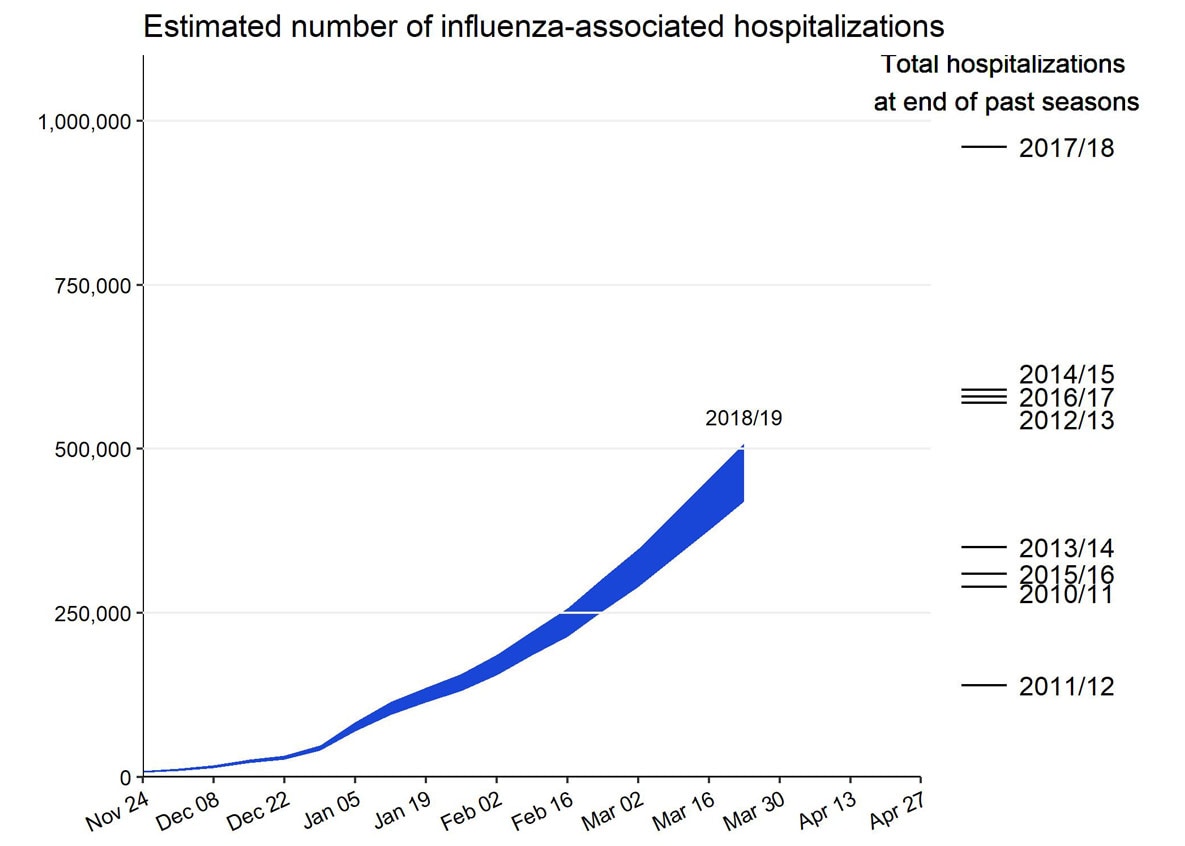
        The number of hospitalizations estimated so far this season is lower than end-of-season total hospitalization estimates for any season since CDC began making these estimates. This table also summarizes all estimated influenza disease burden, by season, in U.S. from 2010-11 through 2017-18.


        Preliminary Cumulative Estimates of Hospitalizations in the U.S. 2018-2019 Flu Season


        *These estimates are preliminary and based on data from CDC’s weekly influenza surveillance reports summarizing key influenza activity indicators.
        508 text for this chart:
        Estimated number of influenza-associated hospitalizations
        The y-axis extends from 0 to 1 million.
        The x-axis is a timeline starting November 24 and extending to April 27.
        There is a single blue-shaded curve labeled with “2018/19”.
        There are several other lines on the right side of the graph under Total hospitalizations at end of past seasons. The lines are labeled, from top to bottom, as 2017/18, 2014/15, 2016/17, 2012/13, 2013/14, 2015/16, 2010/11, and 2011/12.


        [/COLOR]

        CDC's weekly cumulative in-season estimates of flu cases, medical visits, hospitalizations and deaths in the United States.
        Twitter: @RonanKelly13
        The views expressed are mine alone and do not represent the views of my employer or any other person or organization.

        Comment


        • #19
          Influenza deaths
          Week 40: 10
          Week 41: 12
          Week 42: 18
          Week 43: 24
          Week 44: 24
          Week 45: 29
          Week 46: 25
          Week 47: 31
          Week 48: 35
          Week 49: 54
          Week 50: 48
          Week 51: 85
          Week 52: 123
          Week 1: 180
          Week 2: 222
          Week 3: 205
          Week 4: 218
          Week 5: 236
          Week 6: 205
          Total: 1,784

          Pneumonia deaths
          Week 40: 2,944
          Week 41: 2,844
          Week 42: 2,956
          Week 43: 3,037
          Week 44: 2,958
          Week 45: 2,943
          Week 46: 3,067
          Week 47: 3,092
          Week 48: 3,184
          Week 49: 3,238
          Week 50: 3,371
          Week 51: 3,286
          Week 52: 3,360
          Week 1: 3,417
          Week 2: 3,433
          Week 3: 3,485
          Week 4: 3,112
          Week 5: 2,964
          Week 6: 2,263
          Total: 58,954


          Comparison of influenza death certificates Weeks 40 - 6 with corresponding period from previous years (note figures for 2018-19 are preliminary and are likely to increase)
          2018-19: 1,784
          2017-18: 10,022
          2016-17: 2,648
          2015-16: 531
          2014-15: 6,095
          2013-14: 2,994
          2012-13: 3,492

          Click image for larger version

Name:	Influenza Mortality.png
Views:	180
Size:	35.5 KB
ID:	808229


          Twitter: @RonanKelly13
          The views expressed are mine alone and do not represent the views of my employer or any other person or organization.

          Comment


          • #20
            2018-2019 U.S. Flu Season: Preliminary Burden Estimates

            Click image for larger version

Name:	flu estimates.png
Views:	225
Size:	51.6 KB
ID:	808231 *These estimates are preliminary and based on data from CDC?s weekly influenza surveillance reports summarizing key influenza activity indicators.
            On This Page


            This web page provides weekly preliminary estimates of the cumulative in-season numbers of flu illnesses, medical visits, hospitalizations, and deaths in the United States. CDC has estimated the burden of flu since 2010 using a mathematical model that is based on observed rates of laboratory-confirmed influenza-associated hospitalizations collected through a surveillance network that covers approximately 8.5% of the U.S. population (~27 million people).
            The 2018-2019 flu season is the first season CDC has reported in-season burden estimates of flu in the U.S. These in-season estimates will be updated over the course of the flu season.


            Limitations

            The estimates of the cumulative burden of seasonal influenza are subject to several limitations.
            First, the cumulative rate of laboratory-confirmed influenza-associated hospitalizations reported during the season may be an under-estimate of the rate at the end of the season because of identification and reporting delays.
            Second, rates of laboratory-confirmed influenza-associated hospitalizations were adjusted for the frequency of influenza testing and the sensitivity of influenza diagnostic assays. However, data on testing practices during the 2018-2019 season are not available in real-time. CDC used data on testing practices from the 2014-2015 influenza season as a proxy. Burden estimates will be updated at a later date when data on contemporary testing practices become available.
            Third, estimates of influenza-associated illness and medical visits are based on data from prior seasons, which may not be accurate if the seriousness of illness or patterns of care-seeking have changed.
            Frequently Asked Questions

            What does the cumulative burden of influenza for the 2018-2019 season mean?

            The cumulative burden of influenza is an estimate of the number of people who have been sick, seen a healthcare provider, been hospitalized, or died as a result of influenza since October 01, 2018. CDC does not know the exact number of people who have been sick and affected by influenza because influenza is not a reportable disease in most areas of the United States. However, these numbers are estimated using a mathematical model, based on observed rates of laboratory-confirmed influenza-associated hospitalizations.
            How does CDC estimate the cumulative burden of seasonal influenza?

            Preliminary estimates of the cumulative burden of seasonal influenza during the 2018-2019 season in the United States are based on crude rates of laboratory-confirmed influenza-associated hospitalizations, reported through the Influenza Hospitalization Surveillance Network (FluSurv-NET), which were adjusted for the frequency of influenza testing during recent prior seasons and the sensitivity of influenza diagnostic assays. Rates of hospitalization were then multiplied by previously estimated ratio of hospitalizations to symptomatic illnesses, and frequency of seeking medical care to calculate symptomatic illnesses, medical visits, and deaths associated with seasonal influenza, respectively.
            Why does the estimate of cumulative burden change each week?

            The estimates of cumulative burden of seasonal influenza are considered preliminary and may change each week as new laboratory-confirmed influenza-associated hospitalizations are reported to CDC. New reports include both new admissions that have occurred during the reporting week and also patients admitted in previous weeks that have been newly reported to CDC.
            How does the number of flu hospitalizations estimated so far this season compare with previous end-of-season hospitalization estimates?

            The number of hospitalizations estimated so far this season is lower than end-of-season total hospitalization estimates for any season since CDC began making these estimates. This table also summarizes all estimated influenza disease burden, by season, in U.S. from 2010-11 through 2017-18.

            Preliminary Cumulative Estimates of Hospitalizations in the U.S. 2018-2019 Flu Season


            *These estimates are preliminary and based on data from CDC?s weekly influenza surveillance reports summarizing key influenza activity indicators.
            508 text for this chart:
            Estimated number of influenza-associated hospitalizations
            The y-axis extends from 0 to 1 million.
            The x-axis is a timeline starting November 24 and extending to April 27.
            There is a single blue-shaded curve labeled with ?2018/19?.
            There are several other lines on the right side of the graph under Total hospitalizations at end of past seasons. The lines are labeled, from top to bottom, as 2017/18, 2014/15, 2016/17, 2012/13, 2013/14, 2015/16, 2010/11, and 2011/12.
            CDC's weekly cumulative in-season estimates of flu cases, medical visits, hospitalizations and deaths in the United States.


            Twitter: @RonanKelly13
            The views expressed are mine alone and do not represent the views of my employer or any other person or organization.

            Comment


            • #21
              Influenza deaths
              Week 40: 10
              Week 41: 12
              Week 42: 18
              Week 43: 24
              Week 44: 24
              Week 45: 29
              Week 46: 26
              Week 47: 31
              Week 48: 35
              Week 49: 54
              Week 50: 49
              Week 51: 85
              Week 52: 129
              Week 1: 183
              Week 2: 228
              Week 3: 211
              Week 4: 233
              Week 5: 260
              Week 6: 268
              Week 7: 289
              Total: 2,198

              Pneumonia deaths
              Week 40: 2,946
              Week 41: 2,849
              Week 42: 2,960
              Week 43: 3,043
              Week 44: 2,964
              Week 45: 2,951
              Week 46: 3,071
              Week 47: 3,101
              Week 48: 3,198
              Week 49: 3,257
              Week 50: 3,402
              Week 51: 3,336
              Week 52: 3,437
              Week 1: 3,531
              Week 2: 3,547
              Week 3: 3,624
              Week 4: 3,369
              Week 5: 3,271
              Week 6: 3,033
              Week 7: 2,487
              Total: 63,377


              Comparison of influenza death certificates Weeks 40 - 7 with corresponding period from previous years (note figures for 2018-19 are preliminary and are likely to increase)
              2018-19: 2,198
              2017-18: 11,201
              2016-17: 3,192
              2015-16: 680
              2014-15: 6,500
              2013-14: 3,265
              2012-13: 3,701

              Click image for larger version

Name:	Influenza Mortality.png
Views:	174
Size:	36.8 KB
ID:	808560
              Twitter: @RonanKelly13
              The views expressed are mine alone and do not represent the views of my employer or any other person or organization.

              Comment


              • #22
                2018-2019 U.S. Flu Season: Preliminary Burden Estimates


                Language: English (US)
                Click image for larger version

Name:	flu estimates.png
Views:	173
Size:	51.8 KB
ID:	808562


                *These estimates are preliminary and based on data from CDC’s weekly influenza surveillance reports summarizing key influenza activity indicators.
                On This Page


                This web page provides weekly preliminary estimates of the cumulative in-season numbers of flu illnesses, medical visits, hospitalizations, and deaths in the United States. CDC has estimated the burden of flu since 2010 using a mathematical model that is based on observed rates of laboratory-confirmed influenza-associated hospitalizations collected through a surveillance network that covers approximately 8.5% of the U.S. population (~27 million people).
                The 2018-2019 flu season is the first season CDC has reported in-season burden estimates of flu in the U.S. These in-season estimates will be updated over the course of the flu season.


                Limitations

                The estimates of the cumulative burden of seasonal influenza are subject to several limitations.
                First, the cumulative rate of laboratory-confirmed influenza-associated hospitalizations reported during the season may be an under-estimate of the rate at the end of the season because of identification and reporting delays.
                Second, rates of laboratory-confirmed influenza-associated hospitalizations were adjusted for the frequency of influenza testing and the sensitivity of influenza diagnostic assays. However, data on testing practices during the 2018-2019 season are not available in real-time. CDC used data on testing practices from the 2014-2015 influenza season as a proxy. Burden estimates will be updated at a later date when data on contemporary testing practices become available.
                Third, estimates of influenza-associated illness and medical visits are based on data from prior seasons, which may not be accurate if the seriousness of illness or patterns of care-seeking have changed.
                Frequently Asked Questions

                What does the cumulative burden of influenza for the 2018-2019 season mean?

                The cumulative burden of influenza is an estimate of the number of people who have been sick, seen a healthcare provider, been hospitalized, or died as a result of influenza since October 01, 2018. CDC does not know the exact number of people who have been sick and affected by influenza because influenza is not a reportable disease in most areas of the United States. However, these numbers are estimated using a mathematical model, based on observed rates of laboratory-confirmed influenza-associated hospitalizations.
                How does CDC estimate the cumulative burden of seasonal influenza?

                Preliminary estimates of the cumulative burden of seasonal influenza during the 2018-2019 season in the United States are based on crude rates of laboratory-confirmed influenza-associated hospitalizations, reported through the Influenza Hospitalization Surveillance Network (FluSurv-NET), which were adjusted for the frequency of influenza testing during recent prior seasons and the sensitivity of influenza diagnostic assays. Rates of hospitalization were then multiplied by previously estimated ratio of hospitalizations to symptomatic illnesses, and frequency of seeking medical care to calculate symptomatic illnesses, medical visits, and deaths associated with seasonal influenza, respectively.
                Why does the estimate of cumulative burden change each week?

                The estimates of cumulative burden of seasonal influenza are considered preliminary and may change each week as new laboratory-confirmed influenza-associated hospitalizations are reported to CDC. New reports include both new admissions that have occurred during the reporting week and also patients admitted in previous weeks that have been newly reported to CDC.
                How does the number of flu hospitalizations estimated so far this season compare with previous end-of-season hospitalization estimates?

                The number of hospitalizations estimated so far this season is lower than end-of-season total hospitalization estimates for any season since CDC began making these estimates. This table also summarizes all estimated influenza disease burden, by season, in U.S. from 2010-11 through 2017-18.


                Preliminary Cumulative Estimates of Hospitalizations in the U.S. 2018-2019 Flu Season

                *These estimates are preliminary and based on data from CDC’s weekly influenza surveillance reports summarizing key influenza activity indicators.
                508 text for this chart:
                Estimated number of influenza-associated hospitalizations
                The y-axis extends from 0 to 1 million.
                The x-axis is a timeline starting November 24 and extending to April 27.
                There is a single blue-shaded curve labeled with “2018/19”.
                There are several other lines on the right side of the graph under Total hospitalizations at end of past seasons. The lines are labeled, from top to bottom, as 2017/18, 2014/15, 2016/17, 2012/13, 2013/14, 2015/16, 2010/11, and 2011/12.

                https://www.cdc.gov/flu/about/burden...-estimates.htm


                Twitter: @RonanKelly13
                The views expressed are mine alone and do not represent the views of my employer or any other person or organization.

                Comment


                • #23
                  Influenza deaths
                  Week 40: 10
                  Week 41: 12
                  Week 42: 18
                  Week 43: 24
                  Week 44: 24
                  Week 45: 29
                  Week 46: 26
                  Week 47: 31
                  Week 48: 36
                  Week 49: 54
                  Week 50: 49
                  Week 51: 84
                  Week 52: 130
                  Week 1: 193
                  Week 2: 237
                  Week 3: 220
                  Week 4: 244
                  Week 5: 278
                  Week 6: 291
                  Week 7: 344
                  Week 8: 286
                  Total: 2,620

                  Pneumonia deaths
                  Week 40: 2,951
                  Week 41: 2,849
                  Week 42: 2,963
                  Week 43: 3,044
                  Week 44: 2,967
                  Week 45: 2,955
                  Week 46: 3,069
                  Week 47: 3,103
                  Week 48: 3,204
                  Week 49: 3,267
                  Week 50: 3,412
                  Week 51: 3,351
                  Week 52: 3,465
                  Week 1: 3,679
                  Week 2: 3,756
                  Week 3: 3,809
                  Week 4: 3,554
                  Week 5: 3,453
                  Week 6: 3,297
                  Week 7: 3,019
                  Week 8: 2,629
                  Total: 67,796


                  Comparison of influenza death certificates Weeks 40 - 8 with corresponding period from previous years (note figures for 2018-19 are preliminary and are likely to increase)
                  2018-19: 2,620
                  2017-18: 12,087
                  2016-17: 3,798
                  2015-16: 867
                  2014-15: 6,785
                  2013-14: 3,474
                  2012-13: 3,868

                  Click image for larger version

Name:	Influenza Mortality.png
Views:	206
Size:	37.2 KB
ID:	809012
                  Twitter: @RonanKelly13
                  The views expressed are mine alone and do not represent the views of my employer or any other person or organization.

                  Comment


                  • #24
                    2018-2019 U.S. Flu Season: Preliminary Burden Estimates

                    Click image for larger version

Name:	flu estimates.png
Views:	157
Size:	52.3 KB
ID:	809014 *These estimates are preliminary and based on data from CDC?s weekly influenza surveillance reports summarizing key influenza activity indicators.
                    On This Page


                    This web page provides weekly preliminary estimates of the cumulative in-season numbers of flu illnesses, medical visits, hospitalizations, and deaths in the United States. CDC has estimated the burden of flu since 2010 using a mathematical model that is based on observed rates of laboratory-confirmed influenza-associated hospitalizations collected through a surveillance network that covers approximately 8.5% of the U.S. population (~27 million people).
                    The 2018-2019 flu season is the first season CDC has reported in-season burden estimates of flu in the U.S. These in-season estimates will be updated over the course of the flu season.


                    Limitations

                    The estimates of the cumulative burden of seasonal influenza are subject to several limitations.
                    First, the cumulative rate of laboratory-confirmed influenza-associated hospitalizations reported during the season may be an under-estimate of the rate at the end of the season because of identification and reporting delays.
                    Second, rates of laboratory-confirmed influenza-associated hospitalizations were adjusted for the frequency of influenza testing and the sensitivity of influenza diagnostic assays. However, data on testing practices during the 2018-2019 season are not available in real-time. CDC used data on testing practices from the 2014-2015 influenza season as a proxy. Burden estimates will be updated at a later date when data on contemporary testing practices become available.
                    Third, estimates of influenza-associated illness and medical visits are based on data from prior seasons, which may not be accurate if the seriousness of illness or patterns of care-seeking have changed.
                    Frequently Asked Questions

                    What does the cumulative burden of influenza for the 2018-2019 season mean?

                    The cumulative burden of influenza is an estimate of the number of people who have been sick, seen a healthcare provider, been hospitalized, or died as a result of influenza since October 01, 2018. CDC does not know the exact number of people who have been sick and affected by influenza because influenza is not a reportable disease in most areas of the United States. However, these numbers are estimated using a mathematical model, based on observed rates of laboratory-confirmed influenza-associated hospitalizations.
                    How does CDC estimate the cumulative burden of seasonal influenza?

                    Preliminary estimates of the cumulative burden of seasonal influenza during the 2018-2019 season in the United States are based on crude rates of laboratory-confirmed influenza-associated hospitalizations, reported through the Influenza Hospitalization Surveillance Network (FluSurv-NET), which were adjusted for the frequency of influenza testing during recent prior seasons and the sensitivity of influenza diagnostic assays. Rates of hospitalization were then multiplied by previously estimated ratio of hospitalizations to symptomatic illnesses, and frequency of seeking medical care to calculate symptomatic illnesses, medical visits, and deaths associated with seasonal influenza, respectively.
                    Why does the estimate of cumulative burden change each week?

                    The estimates of cumulative burden of seasonal influenza are considered preliminary and may change each week as new laboratory-confirmed influenza-associated hospitalizations are reported to CDC. New reports include both new admissions that have occurred during the reporting week and also patients admitted in previous weeks that have been newly reported to CDC.
                    How does the number of flu hospitalizations estimated so far this season compare with previous end-of-season hospitalization estimates?

                    The number of hospitalizations estimated so far this season is lower than end-of-season total hospitalization estimates for any season since CDC began making these estimates. This table also summarizes all estimated influenza disease burden, by season, in U.S. from 2010-11 through 2017-18.

                    Preliminary Cumulative Estimates of Hospitalizations in the U.S. 2018-2019 Flu Season


                    *These estimates are preliminary and based on data from CDC?s weekly influenza surveillance reports summarizing key influenza activity indicators.
                    508 text for this chart:
                    Estimated number of influenza-associated hospitalizations
                    The y-axis extends from 0 to 1 million.
                    The x-axis is a timeline starting November 24 and extending to April 27.
                    There is a single blue-shaded curve labeled with ?2018/19?.
                    There are several other lines on the right side of the graph under Total hospitalizations at end of past seasons. The lines are labeled, from top to bottom, as 2017/18, 2014/15, 2016/17, 2012/13, 2013/14, 2015/16, 2010/11, and 2011/12.
                    ...
                    CDC's weekly cumulative in-season estimates of flu cases, medical visits, hospitalizations and deaths in the United States.


                    Twitter: @RonanKelly13
                    The views expressed are mine alone and do not represent the views of my employer or any other person or organization.

                    Comment


                    • #25
                      Influenza deaths
                      Week 40: 10
                      Week 41: 12
                      Week 42: 18
                      Week 43: 24
                      Week 44: 24
                      Week 45: 30
                      Week 46: 26
                      Week 47: 31
                      Week 48: 37
                      Week 49: 54
                      Week 50: 49
                      Week 51: 85
                      Week 52: 132
                      Week 1: 199
                      Week 2: 242
                      Week 3: 225
                      Week 4: 246
                      Week 5: 281
                      Week 6: 304
                      Week 7: 372
                      Week 8: 339
                      Week 9: 321
                      Total: 3,061

                      Pneumonia deaths
                      Week 40: 2,952
                      Week 41: 2,852
                      Week 42: 2,964
                      Week 43: 3,046
                      Week 44: 2,985
                      Week 45: 2,997
                      Week 46: 3,109
                      Week 47: 3,142
                      Week 48: 3,236
                      Week 49: 3,279
                      Week 50: 3,424
                      Week 51: 3,368
                      Week 52: 3,488
                      Week 1: 3,743
                      Week 2: 3,839
                      Week 3: 3,866
                      Week 4: 3,608
                      Week 5: 3,524
                      Week 6: 3,445
                      Week 7: 3,310
                      Week 8: 3,188
                      Week 9: 2,391
                      Total: 71,756


                      Comparison of influenza death certificates Weeks 40 - 9 with corresponding period from previous years (note figures for 2018-19 are preliminary and are likely to increase)
                      2018-19: 3,061
                      2017-18: 12,823
                      2016-17: 4,333
                      2015-16: 1,124
                      2014-15: 6,975
                      2013-14: 3,635
                      2012-13: 4,016

                      Click image for larger version

Name:	Influenza Mortality.png
Views:	137
Size:	37.1 KB
ID:	809384
                      Twitter: @RonanKelly13
                      The views expressed are mine alone and do not represent the views of my employer or any other person or organization.

                      Comment


                      • #26
                        2018-2019 U.S. Flu Season: Preliminary Burden Estimates

                        Click image for larger version

Name:	flu estimates.png
Views:	168
Size:	51.0 KB
ID:	809386
                        *These estimates are preliminary and based on data from CDC?s weekly influenza surveillance reports summarizing key influenza activity indicators.
                        On This Page


                        This web page provides weekly preliminary estimates of the cumulative in-season numbers of flu illnesses, medical visits, hospitalizations, and deaths in the United States. CDC has estimated the burden of flu since 2010 using a mathematical model that is based on observed rates of laboratory-confirmed influenza-associated hospitalizations collected through a surveillance network that covers approximately 8.5% of the U.S. population (~27 million people).
                        The 2018-2019 flu season is the first season CDC has reported in-season burden estimates of flu in the U.S. These in-season estimates will be updated over the course of the flu season.


                        Limitations

                        The estimates of the cumulative burden of seasonal influenza are subject to several limitations.
                        First, the cumulative rate of laboratory-confirmed influenza-associated hospitalizations reported during the season may be an under-estimate of the rate at the end of the season because of identification and reporting delays.
                        Second, rates of laboratory-confirmed influenza-associated hospitalizations were adjusted for the frequency of influenza testing and the sensitivity of influenza diagnostic assays. However, data on testing practices during the 2018-2019 season are not available in real-time. CDC used data on testing practices from the 2014-2015 influenza season as a proxy. Burden estimates will be updated at a later date when data on contemporary testing practices become available.
                        Third, estimates of influenza-associated illness and medical visits are based on data from prior seasons, which may not be accurate if the seriousness of illness or patterns of care-seeking have changed.
                        Frequently Asked Questions

                        What does the cumulative burden of influenza for the 2018-2019 season mean?

                        The cumulative burden of influenza is an estimate of the number of people who have been sick, seen a healthcare provider, been hospitalized, or died as a result of influenza since October 01, 2018. CDC does not know the exact number of people who have been sick and affected by influenza because influenza is not a reportable disease in most areas of the United States. However, these numbers are estimated using a mathematical model, based on observed rates of laboratory-confirmed influenza-associated hospitalizations.
                        How does CDC estimate the cumulative burden of seasonal influenza?

                        Preliminary estimates of the cumulative burden of seasonal influenza during the 2018-2019 season in the United States are based on crude rates of laboratory-confirmed influenza-associated hospitalizations, reported through the Influenza Hospitalization Surveillance Network (FluSurv-NET), which were adjusted for the frequency of influenza testing during recent prior seasons and the sensitivity of influenza diagnostic assays. Rates of hospitalization were then multiplied by previously estimated ratio of hospitalizations to symptomatic illnesses, and frequency of seeking medical care to calculate symptomatic illnesses, medical visits, and deaths associated with seasonal influenza, respectively.
                        Why does the estimate of cumulative burden change each week?

                        The estimates of cumulative burden of seasonal influenza are considered preliminary and may change each week as new laboratory-confirmed influenza-associated hospitalizations are reported to CDC. New reports include both new admissions that have occurred during the reporting week and also patients admitted in previous weeks that have been newly reported to CDC.
                        How does the number of flu hospitalizations estimated so far this season compare with previous end-of-season hospitalization estimates?

                        The number of hospitalizations estimated so far this season is lower than end-of-season total hospitalization estimates for any season since CDC began making these estimates. This table also summarizes all estimated influenza disease burden, by season, in U.S. from 2010-11 through 2017-18.

                        Preliminary Cumulative Estimates of Hospitalizations in the U.S. 2018-2019 Flu Season


                        *These estimates are preliminary and based on data from CDC?s weekly influenza surveillance reports summarizing key influenza activity indicators.
                        508 text for this chart:
                        Estimated number of influenza-associated hospitalizations
                        The y-axis extends from 0 to 1 million.
                        The x-axis is a timeline starting November 24 and extending to April 27.
                        There is a single blue-shaded curve labeled with ?2018/19?.
                        There are several other lines on the right side of the graph under Total hospitalizations at end of past seasons. The lines are labeled, from top to bottom, as 2017/18, 2014/15, 2016/17, 2012/13, 2013/14, 2015/16, 2010/11, and 2011/12.

                        CDC's weekly cumulative in-season estimates of flu cases, medical visits, hospitalizations and deaths in the United States.


                        Twitter: @RonanKelly13
                        The views expressed are mine alone and do not represent the views of my employer or any other person or organization.

                        Comment


                        • #27
                          Influenza deaths
                          Week 40: 10
                          Week 41: 12
                          Week 42: 18
                          Week 43: 24
                          Week 44: 24
                          Week 45: 30
                          Week 46: 26
                          Week 47: 31
                          Week 48: 37
                          Week 49: 54
                          Week 50: 49
                          Week 51: 87
                          Week 52: 134
                          Week 1: 200
                          Week 2: 242
                          Week 3: 228
                          Week 4: 247
                          Week 5: 286
                          Week 6: 312
                          Week 7: 395
                          Week 8: 368
                          Week 9: 395
                          Week 10: 331
                          Total: 3,540

                          Pneumonia deaths
                          Week 40: 2,953
                          Week 41: 2,856
                          Week 42: 2,965
                          Week 43: 3,049
                          Week 44: 2,987
                          Week 45: 3,002
                          Week 46: 3,113
                          Week 47: 3,149
                          Week 48: 3,242
                          Week 49: 3,302
                          Week 50: 3,469
                          Week 51: 3,390
                          Week 52: 3,519
                          Week 1: 3,765
                          Week 2: 3,870
                          Week 3: 3,889
                          Week 4: 3,644
                          Week 5: 3,589
                          Week 6: 3,543
                          Week 7: 3,411
                          Week 8: 3,417
                          Week 9: 2,977
                          Week 10: 2,415
                          Total: 75,516


                          Comparison of influenza death certificates Weeks 40 - 10 with corresponding period from previous years (note figures for 2018-19 are preliminary and are likely to increase)
                          2018-19: 3,540
                          2017-18: 13,327
                          2016-17: 4,802
                          2015-16: 1,418
                          2014-15: 7,134
                          2013-14: 3,760
                          2012-13: 4,119

                          Click image for larger version

Name:	Influenza Mortality.png
Views:	145
Size:	37.4 KB
ID:	809844
                          Twitter: @RonanKelly13
                          The views expressed are mine alone and do not represent the views of my employer or any other person or organization.

                          Comment


                          • #28
                            2018-2019 U.S. Flu Season: Preliminary Burden Estimates

                            Click image for larger version

Name:	flu estimates.png
Views:	220
Size:	50.4 KB
ID:	809846 *These estimates are preliminary and based on data from CDC?s weekly influenza surveillance reports summarizing key influenza activity indicators.
                            On This Page


                            This web page provides weekly preliminary estimates of the cumulative in-season numbers of flu illnesses, medical visits, hospitalizations, and deaths in the United States. CDC has estimated the burden of flu since 2010 using a mathematical model that is based on observed rates of laboratory-confirmed influenza-associated hospitalizations collected through a surveillance network that covers approximately 8.5% of the U.S. population (~27 million people).
                            The 2018-2019 flu season is the first season CDC has reported in-season burden estimates of flu in the U.S. These in-season estimates will be updated over the course of the flu season.


                            Limitations

                            The estimates of the cumulative burden of seasonal influenza are subject to several limitations.
                            First, the cumulative rate of laboratory-confirmed influenza-associated hospitalizations reported during the season may be an under-estimate of the rate at the end of the season because of identification and reporting delays.
                            Second, rates of laboratory-confirmed influenza-associated hospitalizations were adjusted for the frequency of influenza testing and the sensitivity of influenza diagnostic assays. However, data on testing practices during the 2018-2019 season are not available in real-time. CDC used data on testing practices from the 2014-2015 influenza season as a proxy. Burden estimates will be updated at a later date when data on contemporary testing practices become available.
                            Third, estimates of influenza-associated illness and medical visits are based on data from prior seasons, which may not be accurate if the seriousness of illness or patterns of care-seeking have changed.
                            Frequently Asked Questions

                            What does the cumulative burden of influenza for the 2018-2019 season mean?

                            The cumulative burden of influenza is an estimate of the number of people who have been sick, seen a healthcare provider, been hospitalized, or died as a result of influenza since October 01, 2018. CDC does not know the exact number of people who have been sick and affected by influenza because influenza is not a reportable disease in most areas of the United States. However, these numbers are estimated using a mathematical model, based on observed rates of laboratory-confirmed influenza-associated hospitalizations.
                            How does CDC estimate the cumulative burden of seasonal influenza?

                            Preliminary estimates of the cumulative burden of seasonal influenza during the 2018-2019 season in the United States are based on crude rates of laboratory-confirmed influenza-associated hospitalizations, reported through the Influenza Hospitalization Surveillance Network (FluSurv-NET), which were adjusted for the frequency of influenza testing during recent prior seasons and the sensitivity of influenza diagnostic assays. Rates of hospitalization were then multiplied by previously estimated ratio of hospitalizations to symptomatic illnesses, and frequency of seeking medical care to calculate symptomatic illnesses, medical visits, and deaths associated with seasonal influenza, respectively.
                            Why does the estimate of cumulative burden change each week?

                            The estimates of cumulative burden of seasonal influenza are considered preliminary and may change each week as new laboratory-confirmed influenza-associated hospitalizations are reported to CDC. New reports include both new admissions that have occurred during the reporting week and also patients admitted in previous weeks that have been newly reported to CDC.
                            How does the number of flu hospitalizations estimated so far this season compare with previous end-of-season hospitalization estimates?

                            The number of hospitalizations estimated so far this season is lower than end-of-season total hospitalization estimates for any season since CDC began making these estimates. This table also summarizes all estimated influenza disease burden, by season, in U.S. from 2010-11 through 2017-18.

                            Preliminary Cumulative Estimates of Hospitalizations in the U.S. 2018-2019 Flu Season


                            *These estimates are preliminary and based on data from CDC?s weekly influenza surveillance reports summarizing key influenza activity indicators.
                            508 text for this chart:
                            Estimated number of influenza-associated hospitalizations
                            The y-axis extends from 0 to 1 million.
                            The x-axis is a timeline starting November 24 and extending to April 27.
                            There is a single blue-shaded curve labeled with ?2018/19?.
                            There are several other lines on the right side of the graph under Total hospitalizations at end of past seasons. The lines are labeled, from top to bottom, as 2017/18, 2014/15, 2016/17, 2012/13, 2013/14, 2015/16, 2010/11, and 2011/12.

                            CDC's weekly cumulative in-season estimates of flu cases, medical visits, hospitalizations and deaths in the United States.


                            Twitter: @RonanKelly13
                            The views expressed are mine alone and do not represent the views of my employer or any other person or organization.

                            Comment


                            • #29
                              Influenza deaths
                              Week 40: 10
                              Week 41: 12
                              Week 42: 18
                              Week 43: 24
                              Week 44: 24
                              Week 45: 30
                              Week 46: 26
                              Week 47: 31
                              Week 48: 37
                              Week 49: 54
                              Week 50: 49
                              Week 51: 87
                              Week 52: 134
                              Week 1: 202
                              Week 2: 245
                              Week 3: 229
                              Week 4: 250
                              Week 5: 298
                              Week 6: 322
                              Week 7: 401
                              Week 8: 380
                              Week 9: 416
                              Week 10: 412
                              Week 11: 306
                              Total: 3,997

                              Pneumonia deaths
                              Week 40: 2,954
                              Week 41: 2,856
                              Week 42: 2,967
                              Week 43: 3,051
                              Week 44: 2,988
                              Week 45: 3,002
                              Week 46: 3,116
                              Week 47: 3,154
                              Week 48: 3,245
                              Week 49: 3,305
                              Week 50: 3,473
                              Week 51: 3,395
                              Week 52: 3,526
                              Week 1: 3,780
                              Week 2: 3,896
                              Week 3: 3,929
                              Week 4: 3,676
                              Week 5: 3,652
                              Week 6: 3,585
                              Week 7: 3,479
                              Week 8: 3,490
                              Week 9: 3,150
                              Week 10: 2,887
                              Week 11: 2,483
                              Total: 79,039


                              Comparison of influenza death certificates Weeks 40 - 11 with corresponding period from previous years (note figures for 2018-19 are preliminary and are likely to increase)
                              2018-19: 3,997
                              2017-18: 13,769
                              2016-17: 5,178
                              2015-16: 1,769
                              2014-15: 7,273
                              2013-14: 3,853
                              2012-13: 4,228

                              Click image for larger version

Name:	Influenza Mortality.png
Views:	156
Size:	37.5 KB
ID:	810230
                              Twitter: @RonanKelly13
                              The views expressed are mine alone and do not represent the views of my employer or any other person or organization.

                              Comment


                              • #30
                                2018-2019 U.S. Flu Season: Preliminary Burden Estimates

                                Click image for larger version

Name:	flu estimates.png
Views:	164
Size:	51.1 KB
ID:	810232 *These estimates are preliminary and based on data from CDC?s weekly influenza surveillance reports summarizing key influenza activity indicators.
                                On This Page


                                This web page provides weekly preliminary estimates of the cumulative in-season numbers of flu illnesses, medical visits, hospitalizations, and deaths in the United States. CDC has estimated the burden of flu since 2010 using a mathematical model that is based on observed rates of laboratory-confirmed influenza-associated hospitalizations collected through a surveillance network that covers approximately 8.5% of the U.S. population (~27 million people).
                                The 2018-2019 flu season is the first season CDC has reported in-season burden estimates of flu in the U.S. These in-season estimates will be updated over the course of the flu season.


                                Limitations

                                The estimates of the cumulative burden of seasonal influenza are subject to several limitations.
                                First, the cumulative rate of laboratory-confirmed influenza-associated hospitalizations reported during the season may be an under-estimate of the rate at the end of the season because of identification and reporting delays.
                                Second, rates of laboratory-confirmed influenza-associated hospitalizations were adjusted for the frequency of influenza testing and the sensitivity of influenza diagnostic assays. However, data on testing practices during the 2018-2019 season are not available in real-time. CDC used data on testing practices from the 2014-2015 influenza season as a proxy. Burden estimates will be updated at a later date when data on contemporary testing practices become available.
                                Third, estimates of influenza-associated illness and medical visits are based on data from prior seasons, which may not be accurate if the seriousness of illness or patterns of care-seeking have changed.
                                Frequently Asked Questions

                                What does the cumulative burden of influenza for the 2018-2019 season mean?

                                The cumulative burden of influenza is an estimate of the number of people who have been sick, seen a healthcare provider, been hospitalized, or died as a result of influenza since October 01, 2018. CDC does not know the exact number of people who have been sick and affected by influenza because influenza is not a reportable disease in most areas of the United States. However, these numbers are estimated using a mathematical model, based on observed rates of laboratory-confirmed influenza-associated hospitalizations.
                                How does CDC estimate the cumulative burden of seasonal influenza?

                                Preliminary estimates of the cumulative burden of seasonal influenza during the 2018-2019 season in the United States are based on crude rates of laboratory-confirmed influenza-associated hospitalizations, reported through the Influenza Hospitalization Surveillance Network (FluSurv-NET), which were adjusted for the frequency of influenza testing during recent prior seasons and the sensitivity of influenza diagnostic assays. Rates of hospitalization were then multiplied by previously estimated ratio of hospitalizations to symptomatic illnesses, and frequency of seeking medical care to calculate symptomatic illnesses, medical visits, and deaths associated with seasonal influenza, respectively.
                                Why does the estimate of cumulative burden change each week?

                                The estimates of cumulative burden of seasonal influenza are considered preliminary and may change each week as new laboratory-confirmed influenza-associated hospitalizations are reported to CDC. New reports include both new admissions that have occurred during the reporting week and also patients admitted in previous weeks that have been newly reported to CDC.
                                How does the number of flu hospitalizations estimated so far this season compare with previous end-of-season hospitalization estimates?

                                The number of hospitalizations estimated so far this season is lower than end-of-season total hospitalization estimates for any season since CDC began making these estimates. This table also summarizes all estimated influenza disease burden, by season, in U.S. from 2010-11 through 2017-18.

                                Preliminary Cumulative Estimates of Hospitalizations in the U.S. 2018-2019 Flu Season


                                *These estimates are preliminary and based on data from CDC?s weekly influenza surveillance reports summarizing key influenza activity indicators.
                                508 text for this chart:
                                Estimated number of influenza-associated hospitalizations
                                The y-axis extends from 0 to 1 million.
                                The x-axis is a timeline starting November 24 and extending to April 27.
                                There is a single blue-shaded curve labeled with ?2018/19?.
                                There are several other lines on the right side of the graph under Total hospitalizations at end of past seasons. The lines are labeled, from top to bottom, as 2017/18, 2014/15, 2016/17, 2012/13, 2013/14, 2015/16, 2010/11, and 2011/12.
                                CDC's weekly cumulative in-season estimates of flu cases, medical visits, hospitalizations and deaths in the United States.


                                Twitter: @RonanKelly13
                                The views expressed are mine alone and do not represent the views of my employer or any other person or organization.

                                Comment

                                Working...
                                X