 Tweet
Tweet
Weekly U.S. Influenza Surveillance Report
Espa?ol

2018-2019 Influenza Season Week 19 ending May 11, 2019
All data are preliminary and may change as more reports are received.
An overview of the CDC influenza surveillance system, including methodology and detailed descriptions of each data component, is available at http://www.cdc.gov/flu/weekly/overview.htm.
Synopsis:
Influenza activity continues to decrease in the United States. While influenza A(H1N1)pdm09 viruses predominated from October to mid-February, influenza A(H3N2) viruses have been more commonly identified since late February. Small numbers of influenza B viruses also have been reported. Below is a summary of the key influenza indicators for the week ending May 11, 2019:
*https://www.hhs.gov/about/agencies/i...ces/index.html
? Elevated means the % of visits for ILI is at or above the national or region-specific baseline
? Includes all 50 states, the District of Columbia, Guam, Puerto Rico, and U.S. Virgin Islands
U.S. Virologic Surveillance:
WHO and NREVSS collaborating laboratories, which include both public health and clinical laboratories located in all 50 states, Puerto Rico, Guam, and the District of Columbia, report to CDC the total number of respiratory specimens tested for influenza and the number positive for influenza by virus type. In addition, public health laboratories also report the influenza A subtype (H1 or H3) and influenza B lineage information of the viruses they test and the age or age group of the persons from whom the specimens were collected.
Additional virologic data, including national, regional and select state-level data, can be found at: http://gis.cdc.gov/grasp/fluview/flu...dashboard.html. Age group proportions and totals by influenza subtype reported by public health laboratories can be found at: http://gis.cdc.gov/grasp/fluview/flu_by_age_virus.html.
The results of tests performed by clinical laboratories are summarized below.
View National and Regional Level Graphs and Data | View Chart Data | View Full Screen | View PowerPoint Presentation The results of tests performed by public health laboratories are summarized below.
*The percent of specimens testing positive for influenza is not reported because public health laboratories often receive samples that have already tested positive for influenza at a clinical laboratory and therefore percent positive would not be a valid indicator of influenza activity. Additional information is available at http://www.cdc.gov/flu/weekly/overview.htm.
View National and Regional Level Graphs and Data | View Chart Data | View Full Screen | View PowerPoint Presentation Influenza Virus Characterization:
Close monitoring of influenza viruses is required to better assess the potential impact on public health. CDC characterizes influenza viruses through one or more tests including genomic sequencing, hemagglutination inhibition (HI) and/or neutralization based Focus Reduction assays (FRA). These data are used to compare how similar currently circulating influenza viruses are to the reference viruses used for developing new influenza vaccines and to monitor evolutionary changes that continually occur in influenza viruses circulating in humans. Antigenic and genetic characterization of circulating influenza viruses gives an indication of the influenza vaccine's ability to induce an immune response against the wide array of influenza viruses that are co-circulating every season. However, annual vaccine effectiveness estimates are needed to determine how much protection was provided to the population by vaccination. On February 14, 2019, interim influenza effectiveness estimates for the 2018-2019 season were released and are available here.
For nearly all influenza-positive surveillance samples received at CDC, next-generation sequencing is performed to determine the genetic identity of circulating influenza viruses and to monitor the evolutionary trajectory of viruses circulating in our population. Virus gene segments are classified into genetic clades/subclades based on phylogenetic analysis. However, genetic changes that classify the clades/subclades do not always result in antigenic changes. ?Antigenic drift? is a term used to describe gradual antigenic change that occurs as viruses evolve changes to escape host immune pressure. Antigenic drift is evaluated by comparing antigenic properties of cell-propagated reference viruses representing currently recommended vaccine components with those of cell-propagated circulating viruses.
CDC has antigenically or genetically characterized 2,612 influenza viruses collected September 30, 2018 ? May 11, 2019, and submitted by U.S. laboratories, including 1,199 influenza A(H1N1)pdm09 viruses, 984 influenza A(H3N2) viruses, and 429 influenza B viruses.
Influenza A Viruses
Influenza B Viruses
The majority of U.S. viruses submitted for characterization come from state and local public health laboratories. Due toRight Size Roadmap considerations, specimen submission guidance to laboratories is that, if available, 2 influenza A(H1N1)pdm09, 2 influenza A(H3N2), and 2 influenza B viruses be submitted every other week. Therefore, the numbers of each virus type/subtype characterized should be more balanced across subtypes/lineages but will not reflect the actual proportion of circulating viruses. In the figure below, the results of tests performed by public health labs are shown on the left and CDC sequence results (by genetic clade/subclade) are shown on the right.
View Chart Data | View Full Screen | View PowerPoint Presentation 2019-2020 Influenza Season - U.S. Influenza Vaccine Composition:
The World Health Organization (WHO) has recommended the Northern Hemisphere 2019-2020 influenza vaccine composition, and the Food and Drug Administration?s Vaccines and Related Biological Products Advisory Committee (VRBPAC) subsequently made the influenza vaccine composition recommendation for the United States. Both agencies recommend that influenza trivalent vaccines contain:
It is recommended that quadrivalent vaccines, which have two influenza B viruses, contain the viruses recommended for the trivalent vaccines, as well as a B/Phuket/3073/2013-like (B/Yamagata lineage) virus. The (H1N1)pdm09 and H3N2 recommendations represents an update to the 2018-2019 Northern Hemisphere vaccines. These vaccine recommendations were based on several factors, including global influenza virologic and epidemiologic surveillance, genetic characterization, antigenic characterization and the candidate vaccine viruses that are available for production.
Antiviral Resistance:
Testing of influenza A(H1N1)pdm09, influenza A(H3N2), and influenza B viruses for resistance to the neuraminidase inhibitors (oseltamivir, zanamivir, and peramivir) is performed at CDC using next-generation sequencing analysis and/or a functional assay. Neuraminidase sequences of viruses are inspected to detect the presence of amino acid substitutions,previously associated with reduced or highly reduced inhibition by any of three neuraminidase inhibitors. In addition, a subset of viruses are tested using the neuraminidase inhibition assay with three neuraminidase inhibitors. The level of neuraminidase activity inhibition is reported using the thresholds recommended by the World Health Organization Expert Working Group of the Global Influenza Surveillance and Response System (GISRS)These samples are routinely obtained for surveillance purposes rather than for diagnostic testing of patients suspected to be infected with an antiviral-resistant virus.
Reporting of baloxavir susceptibility testing for the 2018-2019 influenza season will begin later this season. More information regarding influenza antiviral drug resistance can be found here.
High levels of resistance to the adamantanes (amantadine and rimantadine) persist among influenza A(H1N1)pdm09 and influenza A(H3N2) viruses (the adamantanes are not effective against influenza B viruses). Therefore, data from adamantane resistance testing are not presented below.
Assessment of Virus Susceptibility to Neuraminidase Inhibitors Using Next-Generation Sequencing Analysis and/or Neuraminidase Inhibition Assay
Antiviral treatment as early as possible is recommended for patients with confirmed or suspected influenza who have severe, complicated, or progressive illness; who require hospitalization; or who are at high risk for serious influenza-related complications. Additional information on recommendations for treatment and chemoprophylaxis of influenza virus infection with antiviral agents is available at:http://www.cdc.gov/flu/antivirals/index.htm.
Outpatient Illness Surveillance:
Nationwide during week 19, 1.5% of patient visits reported through the U.S. Outpatient Influenza-like Illness Surveillance Network (ILINet) were due to influenza-like illness (ILI). This percentage is below the national baseline of 2.2%. (ILI is defined as fever (temperature of 100?F [37.8?C] or greater) and cough and/or sore throat.)
On a regional level, the percentage of outpatient visits for ILI ranged from 0.7% to 2.2% during week 19. All regions reported a percentage of outpatient visits for ILI below their region-specific baseline..
Additional data on medically attended visits for ILI for current and past seasons and by geography (national, HHS region, or select states) are available on FluView Interactive http://gis.cdc.gov/grasp/fluview/flu...dashboard.html.
View National and Regional Level Graphs and Data | View Chart Data | View Full Screen | View PowerPoint Presentation
ILINet State Activity Indicator Map:
Data collected in ILINet are used to produce a measure of ILI activity* by state. Activity levels are based on the percent of outpatient visits in a state due to ILI and are compared to the average percent of ILI visits that occur during weeks with little or no influenza virus circulation. Activity levels range from minimal, which would correspond to ILI activity from outpatient clinics being below, or only slightly above, the average, to high, which would correspond to ILI activity from outpatient clinics being much higher than average.
The ILI Activity Indicator Map displays state-specific activity levels for multiple seasons and allows a visual representation of relative activity from state to state. More information is available on FluView Interactive at https://gis.cdc.gov/grasp/fluview/main.html.
During week 19, the following ILI activity levels were experienced:
*This map uses the proportion of outpatient visits to health care providers for ILI to measure the ILI activity level within a state. It does not, however, measure the extent of geographic spread of flu within a state. Therefore, outbreaks occurring in a single city could cause the state to display high activity levels.
Data collected in ILINet may disproportionally represent certain populations within a state, and therefore, may not accurately depict the full picture of influenza activity for the whole state.
Data displayed in this map are based on data collected in ILINet, whereas the State and Territorial flu activity map is based on reports from state and territorial epidemiologists. The data presented in this map are preliminary and may change as more data are received.
Differences in the data presented here by CDC and independently by some state health departments likely represent differing levels of data completeness with data presented by the state likely being the more complete.
Geographic Spread of Influenza as Assessed by State and Territorial Epidemiologists
The influenza activity reported by state and territorial epidemiologists indicates geographic spread of influenza viruses, but does not measure the severity of influenza activity. Additional data displaying the influenza activity reported by state and territorial epidemiologists for the current and past seasons are available on FluView Interactive at https://gis.cdc.gov/grasp/fluview/FluView8.html
During week 19, the following influenza activity was reported:
Espa?ol
2018-2019 Influenza Season Week 19 ending May 11, 2019
All data are preliminary and may change as more reports are received.
An overview of the CDC influenza surveillance system, including methodology and detailed descriptions of each data component, is available at http://www.cdc.gov/flu/weekly/overview.htm.
Synopsis:
Influenza activity continues to decrease in the United States. While influenza A(H1N1)pdm09 viruses predominated from October to mid-February, influenza A(H3N2) viruses have been more commonly identified since late February. Small numbers of influenza B viruses also have been reported. Below is a summary of the key influenza indicators for the week ending May 11, 2019:
- Viral Surveillance:The percentage of respiratory specimens testing positive for influenza viruses in clinical laboratories decreased. During the most recent three weeks, influenza A(H3) viruses were reported more frequently than influenza A(H1N1)pdm09 viruses nationally.
- Virus Characterization:The majority of influenza A(H1N1)pdm09 and influenza B viruses characterized antigenically are similar to the cell-grown reference viruses representing the 2018?2019 Northern Hemisphere influenza vaccine viruses. However, the majority of influenza A(H3N2) viruses are antigenically distinguishable from A/Singapore/INFIMH-16-0019/2016 (3C.2a1), a cell-propagated reference virus representing the A(H3N2) component of 2018-19 Northern Hemisphere influenza vaccines.
- Antiviral Resistance:The vast majority of influenza viruses tested (>99%) show susceptibility to oseltamivir and peramivir. All influenza viruses tested showed susceptibility to zanamivir.
- Influenza-like Illness Surveillance:The proportion of outpatient visits for influenza-like illness (ILI) decreased to 1.5%, which is below the national baseline of 2.2%. All regions reported ILI below their region-specific baseline level.
- ILI State Activity Indictor Map: Puerto Rico and one state experienced low ILI activity; and New York City and 49 states experienced minimal ILI activity; and the District of Columbia and the U.S. Virgin Islands had insufficient data.
- Geographic Spread of Influenza: The geographic spread of influenza in Puerto Rico and four states was reported as regional; 16 states reported local activity; the District of Columbia, the U.S. Virgin Islands and 28 states reported sporadic activity; two states reported no activity; and Guam did not report.
- Influenza-associated Hospitalizations A cumulative rate of 65.7 laboratory-confirmed influenza-associated hospitalizations per 100,000 population was reported. The highest hospitalization rate is among adults 65 years and older (221.8 hospitalizations per 100,000 population).
- Pneumonia and Influenza Mortality: The proportion of deaths attributed to pneumonia and influenza (P&I) was below the system-specific epidemic threshold in the National Center for Health Statistics (NCHS) Mortality Surveillance System.
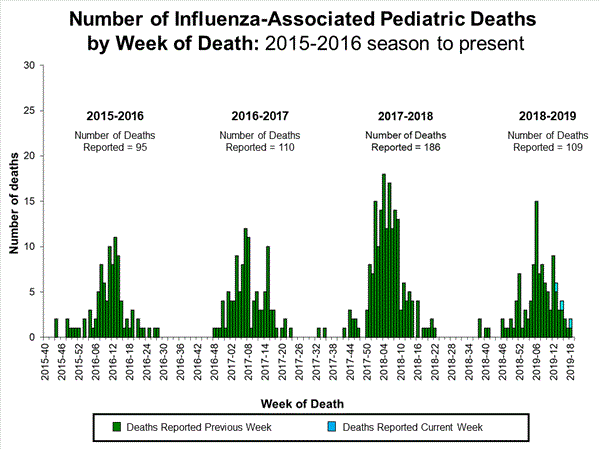
- Influenza-associated Pediatric Deaths: Three influenza-associated pediatric deaths were reported to CDC during week 19.
| Normal | 5 of 54 | 3.7% | Influenza A(H3) |
| Normal | 2 of 6 | 6.8% | Influenza A |
| Normal | 2 of 4 | 3.7% | Influenza A(H3) |
| Normal | 0 of 6 | 1.7% | Influenza A |
| Normal | 0 of 8 | 5.6% | Influenza A(H3) |
| Normal | 0 of 6 | 6.5% | Influenza A(H3) |
| Normal | 0 of 5 | 5.0% | Influenza A |
| Normal | 0 of 4 | 2.7% | Influenza A |
| Normal | 0 of 6 | 3.5% | Influenza A(H3) |
| Normal | 1 of 5 | 5.9% | Influenza A(H3) |
| Normal | 0 of 4 | 2.7% | Influenza A |
? Elevated means the % of visits for ILI is at or above the national or region-specific baseline
? Includes all 50 states, the District of Columbia, Guam, Puerto Rico, and U.S. Virgin Islands
U.S. Virologic Surveillance:
WHO and NREVSS collaborating laboratories, which include both public health and clinical laboratories located in all 50 states, Puerto Rico, Guam, and the District of Columbia, report to CDC the total number of respiratory specimens tested for influenza and the number positive for influenza by virus type. In addition, public health laboratories also report the influenza A subtype (H1 or H3) and influenza B lineage information of the viruses they test and the age or age group of the persons from whom the specimens were collected.
Additional virologic data, including national, regional and select state-level data, can be found at: http://gis.cdc.gov/grasp/fluview/flu...dashboard.html. Age group proportions and totals by influenza subtype reported by public health laboratories can be found at: http://gis.cdc.gov/grasp/fluview/flu_by_age_virus.html.
The results of tests performed by clinical laboratories are summarized below.
| 13,661 | 1,123,357 |
| 506 (3.7%) | 176,109 (15.7%) |
| 308 (60.9%) | 166,996 (94.8%) |
| 198 (39.1%) | 9,113 (5.2%) |
View National and Regional Level Graphs and Data | View Chart Data | View Full Screen | View PowerPoint Presentation The results of tests performed by public health laboratories are summarized below.
| 336 | 78,965 |
| 51 | 41,452 |
| 35 (68.6%) | 39,908 (96.3%) |
| 14 (43.8%) | 21,855 (57.0%) |
| 18 (56.3%) | 16,490 (43.0%) |
| 3 | 1,563 |
| 16 (31.4%) | 1,544 (3.7%) |
| 2 (25.0%) | 381(38.2%) |
| 6 (75.0%) | 617 (61.8%) |
| 8 | 546 |
View National and Regional Level Graphs and Data | View Chart Data | View Full Screen | View PowerPoint Presentation Influenza Virus Characterization:
Close monitoring of influenza viruses is required to better assess the potential impact on public health. CDC characterizes influenza viruses through one or more tests including genomic sequencing, hemagglutination inhibition (HI) and/or neutralization based Focus Reduction assays (FRA). These data are used to compare how similar currently circulating influenza viruses are to the reference viruses used for developing new influenza vaccines and to monitor evolutionary changes that continually occur in influenza viruses circulating in humans. Antigenic and genetic characterization of circulating influenza viruses gives an indication of the influenza vaccine's ability to induce an immune response against the wide array of influenza viruses that are co-circulating every season. However, annual vaccine effectiveness estimates are needed to determine how much protection was provided to the population by vaccination. On February 14, 2019, interim influenza effectiveness estimates for the 2018-2019 season were released and are available here.
For nearly all influenza-positive surveillance samples received at CDC, next-generation sequencing is performed to determine the genetic identity of circulating influenza viruses and to monitor the evolutionary trajectory of viruses circulating in our population. Virus gene segments are classified into genetic clades/subclades based on phylogenetic analysis. However, genetic changes that classify the clades/subclades do not always result in antigenic changes. ?Antigenic drift? is a term used to describe gradual antigenic change that occurs as viruses evolve changes to escape host immune pressure. Antigenic drift is evaluated by comparing antigenic properties of cell-propagated reference viruses representing currently recommended vaccine components with those of cell-propagated circulating viruses.
CDC has antigenically or genetically characterized 2,612 influenza viruses collected September 30, 2018 ? May 11, 2019, and submitted by U.S. laboratories, including 1,199 influenza A(H1N1)pdm09 viruses, 984 influenza A(H3N2) viruses, and 429 influenza B viruses.
Influenza A Viruses
Influenza B Viruses
The majority of U.S. viruses submitted for characterization come from state and local public health laboratories. Due toRight Size Roadmap considerations, specimen submission guidance to laboratories is that, if available, 2 influenza A(H1N1)pdm09, 2 influenza A(H3N2), and 2 influenza B viruses be submitted every other week. Therefore, the numbers of each virus type/subtype characterized should be more balanced across subtypes/lineages but will not reflect the actual proportion of circulating viruses. In the figure below, the results of tests performed by public health labs are shown on the left and CDC sequence results (by genetic clade/subclade) are shown on the right.
View Chart Data | View Full Screen | View PowerPoint Presentation 2019-2020 Influenza Season - U.S. Influenza Vaccine Composition:
The World Health Organization (WHO) has recommended the Northern Hemisphere 2019-2020 influenza vaccine composition, and the Food and Drug Administration?s Vaccines and Related Biological Products Advisory Committee (VRBPAC) subsequently made the influenza vaccine composition recommendation for the United States. Both agencies recommend that influenza trivalent vaccines contain:
It is recommended that quadrivalent vaccines, which have two influenza B viruses, contain the viruses recommended for the trivalent vaccines, as well as a B/Phuket/3073/2013-like (B/Yamagata lineage) virus. The (H1N1)pdm09 and H3N2 recommendations represents an update to the 2018-2019 Northern Hemisphere vaccines. These vaccine recommendations were based on several factors, including global influenza virologic and epidemiologic surveillance, genetic characterization, antigenic characterization and the candidate vaccine viruses that are available for production.
Antiviral Resistance:
Testing of influenza A(H1N1)pdm09, influenza A(H3N2), and influenza B viruses for resistance to the neuraminidase inhibitors (oseltamivir, zanamivir, and peramivir) is performed at CDC using next-generation sequencing analysis and/or a functional assay. Neuraminidase sequences of viruses are inspected to detect the presence of amino acid substitutions,previously associated with reduced or highly reduced inhibition by any of three neuraminidase inhibitors. In addition, a subset of viruses are tested using the neuraminidase inhibition assay with three neuraminidase inhibitors. The level of neuraminidase activity inhibition is reported using the thresholds recommended by the World Health Organization Expert Working Group of the Global Influenza Surveillance and Response System (GISRS)These samples are routinely obtained for surveillance purposes rather than for diagnostic testing of patients suspected to be infected with an antiviral-resistant virus.
Reporting of baloxavir susceptibility testing for the 2018-2019 influenza season will begin later this season. More information regarding influenza antiviral drug resistance can be found here.
High levels of resistance to the adamantanes (amantadine and rimantadine) persist among influenza A(H1N1)pdm09 and influenza A(H3N2) viruses (the adamantanes are not effective against influenza B viruses). Therefore, data from adamantane resistance testing are not presented below.
Assessment of Virus Susceptibility to Neuraminidase Inhibitors Using Next-Generation Sequencing Analysis and/or Neuraminidase Inhibition Assay
| Oseltamivir | Peramivir | Zanamivir | ||||||
| 2,547 | 2 (0.1%) | 4 (0.2%) | 2,547 | 0 (0%) | 4 (0.2%) | 2,547 | 0 (0%) | 0 (0%) |
| 1,183 | 2 (0.2%) | 4 (0.3%) | 1,183 | 0 (0%) | 4 (0.3%) | 1,183 | 0 (0%) | 0 (0%) |
| 969 | 0 (0%) | 0 (0%) | 969 | 0 (0%) | 0 (0%) | 969 | 0 (0%) | 0 (0%) |
| 215 | 0 (0%) | 0 (0%) | 215 | 0 (0%) | 0 (0%) | 215 | 0 (0%) | 0 (0%) |
| 180 | 0 (0%) | 0 (0%) | 180 | 0 (0%) | 0 (0%) | 180 | 0 (0%) | 0 (0%) |
Antiviral treatment as early as possible is recommended for patients with confirmed or suspected influenza who have severe, complicated, or progressive illness; who require hospitalization; or who are at high risk for serious influenza-related complications. Additional information on recommendations for treatment and chemoprophylaxis of influenza virus infection with antiviral agents is available at:http://www.cdc.gov/flu/antivirals/index.htm.
Outpatient Illness Surveillance:
Nationwide during week 19, 1.5% of patient visits reported through the U.S. Outpatient Influenza-like Illness Surveillance Network (ILINet) were due to influenza-like illness (ILI). This percentage is below the national baseline of 2.2%. (ILI is defined as fever (temperature of 100?F [37.8?C] or greater) and cough and/or sore throat.)
On a regional level, the percentage of outpatient visits for ILI ranged from 0.7% to 2.2% during week 19. All regions reported a percentage of outpatient visits for ILI below their region-specific baseline..
Additional data on medically attended visits for ILI for current and past seasons and by geography (national, HHS region, or select states) are available on FluView Interactive http://gis.cdc.gov/grasp/fluview/flu...dashboard.html.
View National and Regional Level Graphs and Data | View Chart Data | View Full Screen | View PowerPoint Presentation
ILINet State Activity Indicator Map:
Data collected in ILINet are used to produce a measure of ILI activity* by state. Activity levels are based on the percent of outpatient visits in a state due to ILI and are compared to the average percent of ILI visits that occur during weeks with little or no influenza virus circulation. Activity levels range from minimal, which would correspond to ILI activity from outpatient clinics being below, or only slightly above, the average, to high, which would correspond to ILI activity from outpatient clinics being much higher than average.
The ILI Activity Indicator Map displays state-specific activity levels for multiple seasons and allows a visual representation of relative activity from state to state. More information is available on FluView Interactive at https://gis.cdc.gov/grasp/fluview/main.html.
During week 19, the following ILI activity levels were experienced:
*This map uses the proportion of outpatient visits to health care providers for ILI to measure the ILI activity level within a state. It does not, however, measure the extent of geographic spread of flu within a state. Therefore, outbreaks occurring in a single city could cause the state to display high activity levels.
Data collected in ILINet may disproportionally represent certain populations within a state, and therefore, may not accurately depict the full picture of influenza activity for the whole state.
Data displayed in this map are based on data collected in ILINet, whereas the State and Territorial flu activity map is based on reports from state and territorial epidemiologists. The data presented in this map are preliminary and may change as more data are received.
Differences in the data presented here by CDC and independently by some state health departments likely represent differing levels of data completeness with data presented by the state likely being the more complete.
Geographic Spread of Influenza as Assessed by State and Territorial Epidemiologists
The influenza activity reported by state and territorial epidemiologists indicates geographic spread of influenza viruses, but does not measure the severity of influenza activity. Additional data displaying the influenza activity reported by state and territorial epidemiologists for the current and past seasons are available on FluView Interactive at https://gis.cdc.gov/grasp/fluview/FluView8.html
During week 19, the following influenza activity was reported:
- A (H1N1)pdm09: Phylogenetic analysis of the HA genes from 1,199 A(H1N1)pdm09 viruses showed that all belonged to clade 6B.1. Three hundred and five A(H1N1)pdm09 viruses were antigenically characterized, and 296 (97%) were antigenically similar (analyzed using HI with ferret antisera) to A/Michigan/45/2015 (6B.1), a cell-propagated A/Michigan/45/2015-like reference virus representing the A(H1N1)pdm09 component for the 2018-19 Northern Hemisphere influenza vaccines.
- A (H3N2): Phylogenetic analysis of the HA genes from 984 A(H3N2) viruses revealed extensive genetic diversity with multiple clades/subclades co-circulating. The HA genes of circulating viruses belonged to clade 3C.2a (n=66), subclade 3C.2a1 (n=195) or clade 3C.3a (n=723). Three hundred eighty-six A(H3N2) viruses were antigenically characterized by FRA with ferret antisera, and 169 (43.8%) A(H3N2) viruses tested were well-inhibited (reacting at titers that were within 4-fold of the homologous virus titer) by ferret antisera raised against A/Singapore/INFIMH-16-0019/2016 (3C.2a1), a cell-propagated reference virus representing the A(H3N2) component of 2018-19 Northern Hemisphere influenza vaccines. Two hundred and seventeen (56.2%) viruses reacted poorly (at titers that were 8-fold or greater reduced compared with that of the homologous virus A/Singapore/INFIMH-16-0019/2016) and of those, 216 (99.5%) belonged to clade 3C.3a.
- B/Victoria: Phylogenetic analysis of 237 B/Victoria-lineage viruses indicate that all HA genes belonged to genetic clade V1A, however genetic subclades which are antigenically distinct have emerged. Genetic subclades which are antigenically distinct include viruses with a two amino acid deletion (162-163) in the HA protein (V1A.1, previously abbreviated as V1A-2Del) and viruses with a three amino acid deletion (162-164) in the HA protein (abbreviated as V1A-3Del). One hundred sixty B/Victoria lineage viruses were antigenically characterized and 127 (79.4%) were antigenically similar with ferret antisera raised against cell-propagated B/Colorado/06/2017-like V1A.1 reference virus. Thirty-three (20.6%) viruses reacted poorly (at titers that were 8-fold or greater reduced compared with the homologous virus titer) and belonged to clade V1A or genetic subclade V1A-3Del.
- B/Yamagata: Phylogenetic analysis of 192 influenza B/Yamagata-lineage viruses indicate that the HA genes belonged to clade Y3. A total of 168 influenza B/Yamagata-lineage viruses were antigenically characterized, and all were antigenically similar to cell-propagated B/Phuket/3073/2013 (Y3), the reference vaccine virus representing the influenza B/Yamagata-lineage component of the 2018-19 Northern Hemisphere quadrivalent vaccines.
- an A/Brisbane/02/2018 (H1N1)pdm09-like virus
- an A/Kansas/14/2017 (H3N2)-like virus and
- a B/Colorado/06/2017-like (B/Victoria lineage) virus
- Puerto Rico and one state (Kentucky) experienced low ILI activity.
- New York City and 49 states (Alabama, Alaska, Arizona, Arkansas, California, Colorado, Connecticut, Delaware, Florida, Georgia, Hawaii, Idaho, Illinois, Indiana, Iowa, Kansas, Louisiana, Maine, Maryland, Massachusetts, Michigan, Minnesota, Mississippi, Missouri, Montana, Nebraska, Nevada, New Hampshire, New Jersey, New Mexico, New York, North Carolina, North Dakota, Ohio, Oklahoma, Oregon, Pennsylvania, Rhode Island, South Carolina, South Dakota, Tennessee, Texas, Utah, Vermont, Virginia, Washington, West Virginia, Wisconsin and Wyoming) experienced minimal ILI activity.
- Data were insufficient to calculate an ILI activity level from the District of Columbia and the U.S. Virgin Islands.
- Regional influenza activity was reported by Puerto Rico and four states (Arizona, Connecticut, Massachusetts and New York).
- Regional influenza activity was reported by Puerto Rico and seven states (Arizona, Connecticut, Kentucky, Nevada, Ohio, Utah and Washington).
- Local influenza activity was reported by 16 states (Florida, Georgia, Hawaii, Kentucky, Louisiana, Maine, Michigan, Minnesota, Nevada, New Hampshire, Ohio, Pennsylvania, South Carolina, Utah, Vermont and Washington).
- Sporadic influenza activity was reported by the District of Columbia, the U.S. Virgin Islands and 28 states (Alabama, Arkansas, California, Colorado, Delaware, Idaho, Illinois, Indiana, Iowa, Maryland, Mississippi, Missouri, Montana, Nebraska, New Jersey, New Mexico, North Carolina, North Dakota, Oklahoma, Oregon, Rhode Island, South Dakota, Tennessee, Texas, Virginia, West Virginia, Wisconsin and Wyoming).
- No activity was reported by two states (Alaska and Kansas).
- Guam did not report.
Influenza-Associated Hospitalizations:
The Influenza Hospitalization Surveillance Network (FluSurv-NET) conducts population-based surveillance for laboratory-confirmed influenza-related hospitalizations in select counties in the Emerging Infections Program (EIP) states and Influenza Hospitalization Surveillance Project (IHSP) states.
A total of 18,973 laboratory-confirmed influenza-associated hospitalizations were reported by FluSurv-NET sites between October 1, 2018 and April 30, 2019. The overall hospitalization rate was 65.7 per 100,000 population. The highest rate of hospitalization was among adults aged ≥65 (221.5 per 100,000 population), followed by adults aged 50-64 (81.3 per 100,000 population) and children aged 0-4 (73.6 per 100,000 population). Among 18,973 hospitalizations, 18,104 (95.4%) were associated with influenza A virus, 717 (3.8%) with influenza B virus, 41 (0.2%) with influenza A virus and influenza B virus co-infection, and 111 (0.6%) with influenza virus for which the type was not determined. Among those with influenza A subtype information, 3,234 (53.9%) were A(H1N1)pdm09 virus and 2,764 (46.1%) were A(H3N2).
Among 4,565 hospitalized adults with information on underlying medical conditions, 91.7% had at least one reported underlying medical condition, the most commonly reported were cardiovascular disease, metabolic disorder, and obesity. Among 852 hospitalized children with information on underlying medical conditions, 52.7% had at least one underlying medical condition; the most commonly reported was asthma. Among 593 hospitalized women of childbearing age (15-44 years) with information on pregnancy status, 27.2% were pregnant.
While patients admitted after April 30, 2019 will not be included, data on patients admitted through April 30, 2019 will continue to be updated as additional information is received.
Additional FluSurv-NET data displaying hospitalization rates for the current and past seasons and different age groups (including rates for patients 65-74 years, 74-84 years, and 85 years of age and older), as well as data on patient characteristics (such as influenza virus type, demographic, and clinical information), are available on FluView Interactive at: http://gis.cdc.gov/GRASP/Fluview/FluHospRates.html and http://gis.cdc.gov/grasp/fluview/FluHospChars.html.
FluSurv-Net data is used to generate national estimates of the total numbers of flu cases, medical visits, hospitalizations, and deaths. This season, CDC is reporting preliminary cumulative in-season estimates, which are available at https://cdc.gov/flu/about/burden/preliminary-in-season-estimates.htm.
Data from the Influenza Hospitalization Surveillance Network (FluSurv-NET), a population-based surveillance for influenza related hospitalizations in children and adults in 13 U.S. states. Cumulative incidence rates are calculated using the National Center for Health Statistics? (NCHS) population estimates for the counties included in the surveillance catchment area.
View Interactive Application | View Full Screen | View PowerPoint PresentationFluSurv-NET data are preliminary and displayed as they become available. Therefore, figures are based on varying denominators as some variables represent information that may require more time to be collected. Data are refreshed and updated weekly. Asthma includes a medical diagnosis of asthma or reactive airway disease; Cardiovascular diseases include conditions such as coronary heart disease, cardiac valve disorders, congestive heart failure, and pulmonary hypertension; does not include isolated hypertension; Chronic lung diseasesinclude conditions such as chronic obstructive pulmonary disease, bronchiolitis obliterans, chronic aspiration pneumonia, and interstitial lung disease; Immune suppression includes conditions such as immunoglobulin deficiency, leukemia, lymphoma, HIV/AIDS, and individuals taking immunosuppressive medications; Metabolic disorders include conditions such as diabetes mellitus; Neurologic diseases include conditions such as seizure disorders, cerebral palsy, and cognitive dysfunction; Neuromuscular diseases include conditions such as multiple sclerosis and muscular dystrophy; Obesity was assigned if indicated in patient's medical chart or if body mass index (BMI) >30 kg/m2; Pregnancy percentage calculated using number of female cases aged between 15 and 44 years of age as the denominator; Renal diseases include conditions such as acute or chronic renal failure, nephrotic syndrome, glomerulonephritis, and impaired creatinine clearance; No known condition indicates that the case did not have any known high risk medical condition indicated in medical chart at the time of hospitalization.
View Interactive Application | View Full Screen | View PowerPoint Presentation
Pneumonia and Influenza (P&I) Mortality Surveillance:
Based on National Center for Health Statistics (NCHS) mortality surveillance data available on May 16, 2019, 5.6% of the deaths occurring during the week ending May 4, 2019 (week 18) were due to P&I. This percentage is below the epidemic threshold of 6.7% for week 18.
Additional pneumonia and influenza mortality data for current and past seasons and by geography (national, HHS region, or state) are available on FluView Interactive http://gis.cdc.gov/grasp/fluview/mortality.html. Data displayed on the regional and state-level are aggregated by the state of residence of the decedent.
View Regional and State Level Data | View Chart Data | View Full Screen | View PowerPoint Presentation
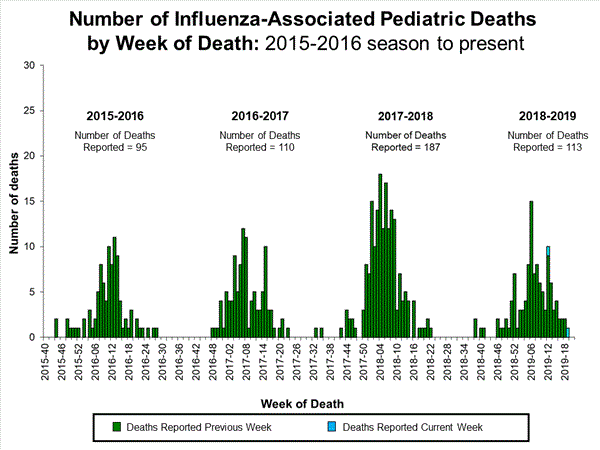
Influenza-Associated Pediatric Mortality:
Three influenza-associated pediatric deaths were reported to CDC during week 19. Two deaths were associated with an influenza A(H1N1)pdm09 virus and occurred during weeks 13 and 18 (the weeks ending March 30 and May 4, 2019). One death was associated with an influenza A virus for which no subtyping was performed and occurred during week 18 (the week ending May 4, 2019).
A total of 109 influenza-associated pediatric deaths occurring during the 2018-2019 season have been reported to CDC.
Additional information on influenza-associated pediatric deaths including basic demographics, underlying conditions, bacterial co-infections, and place of death for the current and past seasons, is available on FluView Interactive http://gis.cdc.gov/GRASP/Fluview/PedFluDeath.html.
View Interactive Application | View Full Screen | View PowerPoint Presentation
Additional National and International Influenza Surveillance Information
FluView Interactive: FluView includes enhanced web-based interactive applications that can provide dynamic visuals of the influenza data collected and analyzed by CDC. These FluView Interactive applications allow people to create customized, visual interpretations of influenza data, as well as make comparisons across flu seasons, regions, age groups and a variety of other demographics. To access these tools, visithttp://www.cdc.gov/flu/weekly/fluviewinteractive.htm.
U.S. State and local influenza surveillance: Click on a jurisdiction below to access the latest local influenza information.
World Health Organization: Additional influenza surveillance information from participating WHO member nations is available through FluNet and the Global Epidemiology Reports.
WHO Collaborating Centers for Influenza located in Australia, China, Japan, the United Kingdom, and the United States (CDC in Atlanta, Georgia).
Europe: For the most recent influenza surveillance information from Europe, please see WHO/Europe and the European Centre for Disease Prevention and Control at http://www.flunewseurope.org/.
Public Health Agency of Canada: The most up-to-date influenza information from Canada is available athttp://www.phac-aspc.gc.ca/fluwatch/
Public Health England: The most up-to-date influenza information from the United Kingdom is available athttps://www.gov.uk/government/statistics/weekly-national-flu-reports- Any links provided to non-Federal organizations are provided solely as a service to our users. These links do not constitute an endorsement of these organizations or their programs by CDC or the Federal Government, and none should be inferred. CDC is not responsible for the content of the individual organization web pages found at these links.
An overview of the CDC influenza surveillance system, including methodology and detailed descriptions of each data component, is available at: http://www.cdc.gov/flu/weekly/overview.htm.
--------------------------------------------------------------------------------
- Any links provided to non-Federal organizations are provided solely as a service to our users. These links do not constitute an endorsement of these organizations or their programs by CDC or the Federal Government, and none should be inferred. CDC is not responsible for the content of the individual organization web pages found at these links.
Page last reviewed: May 17, 2019 Content source: Centers for Disease Control and Prevention, National Center for Immunization and Respiratory Diseases (NCIRD)

Comment