 Tweet
Tweet

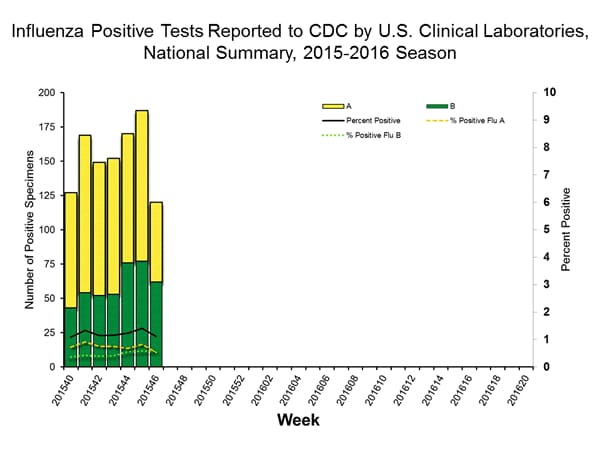
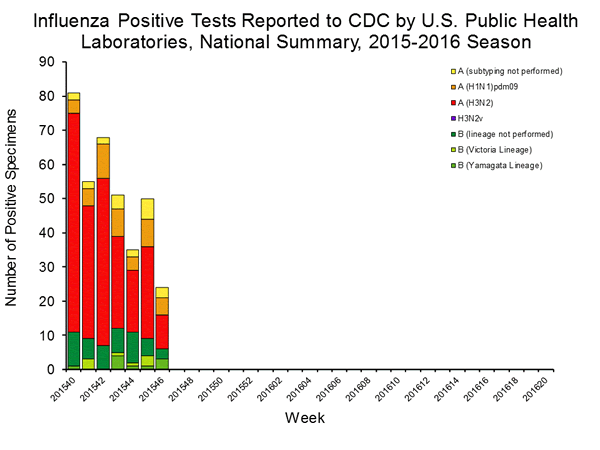
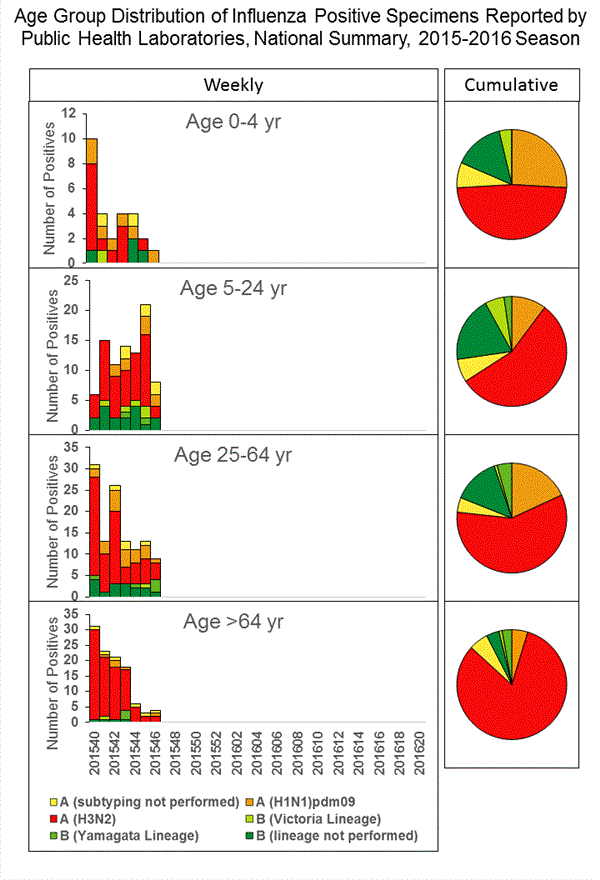
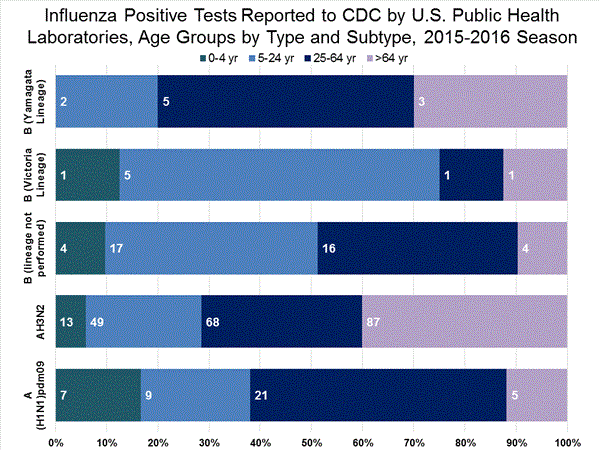
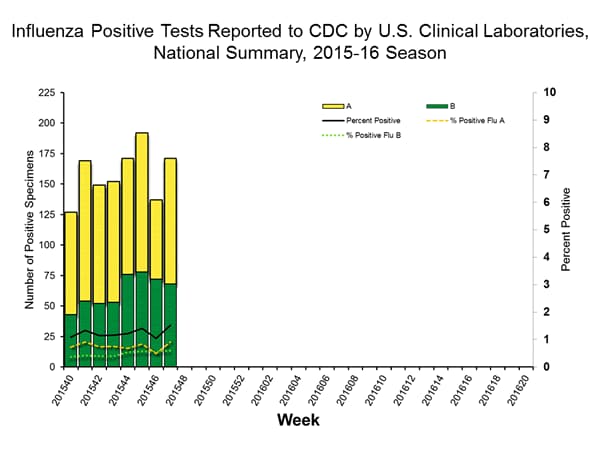
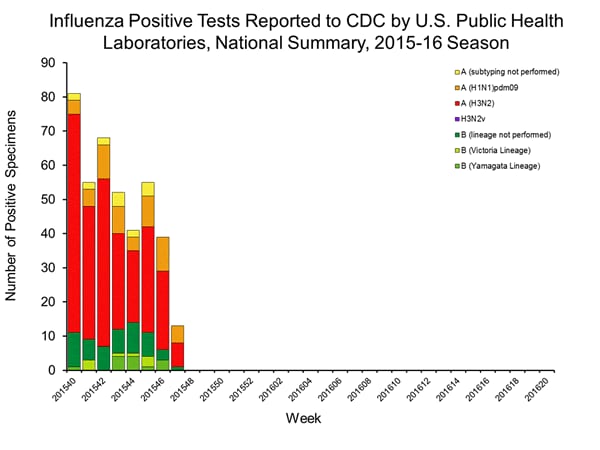
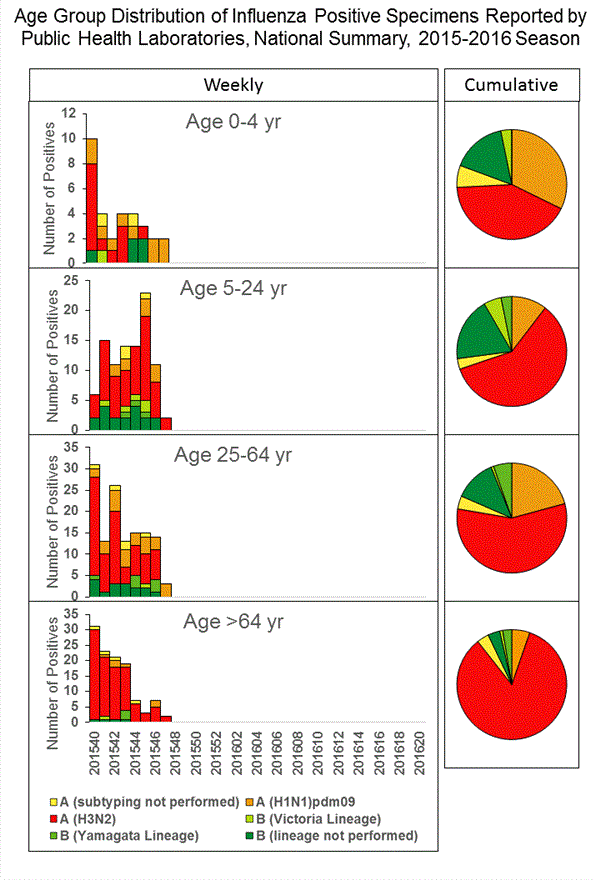
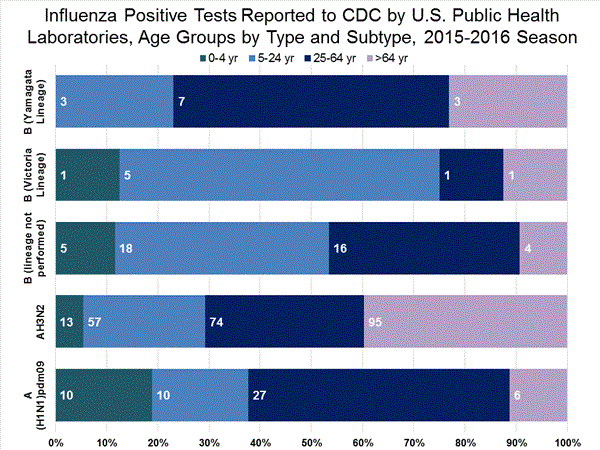
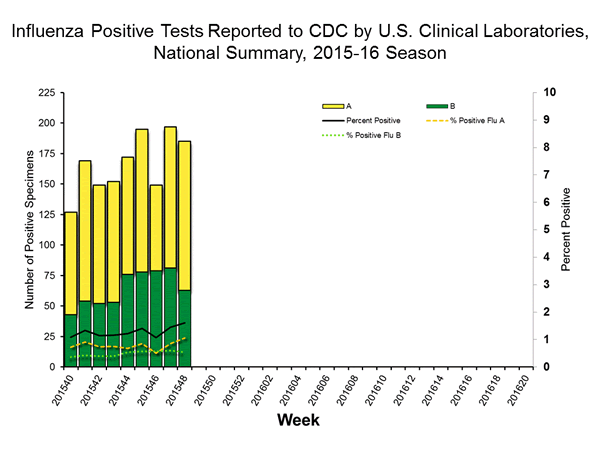
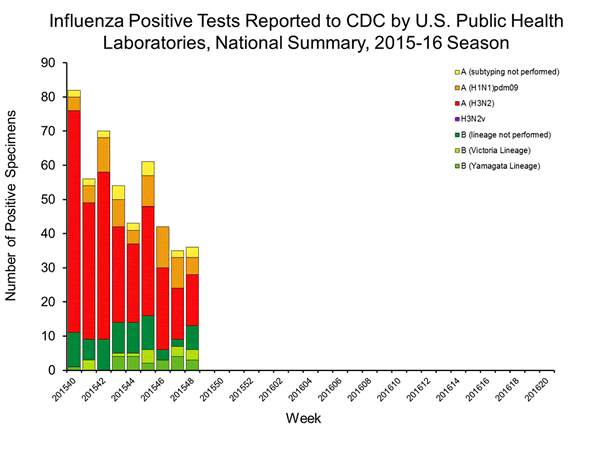
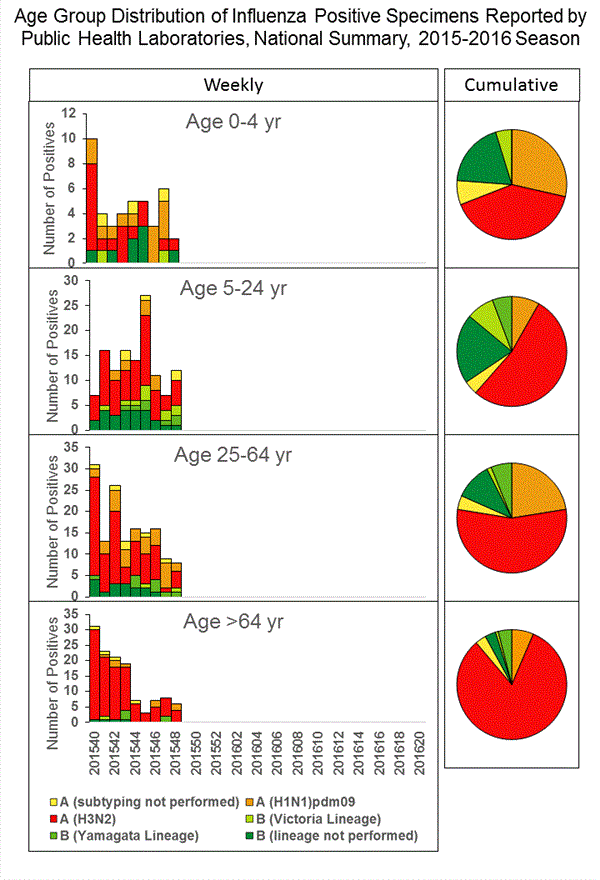
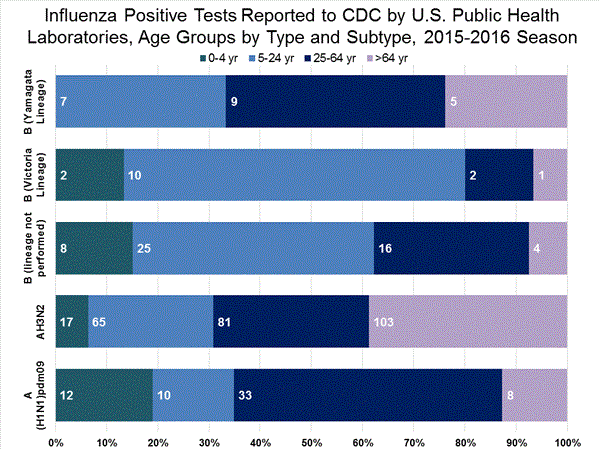
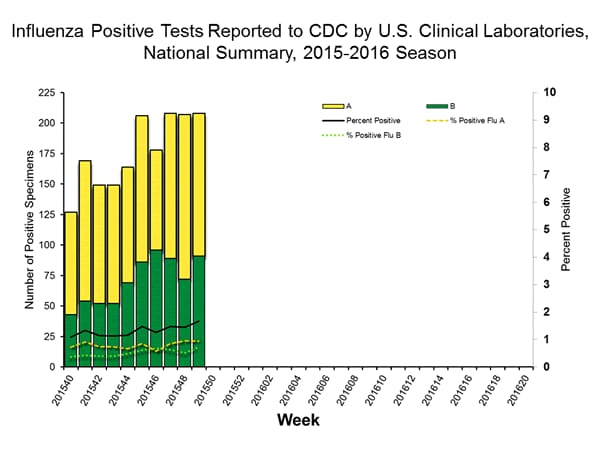
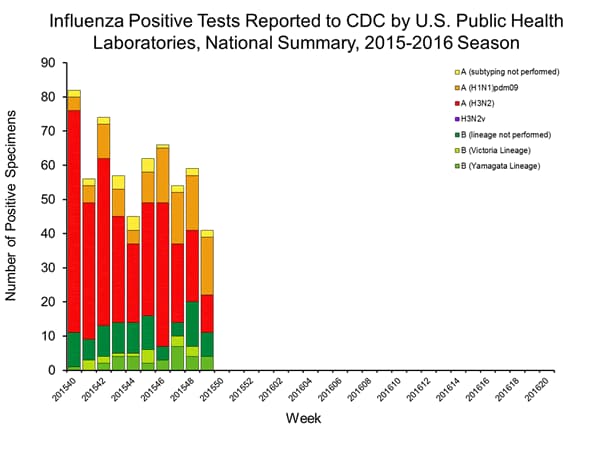
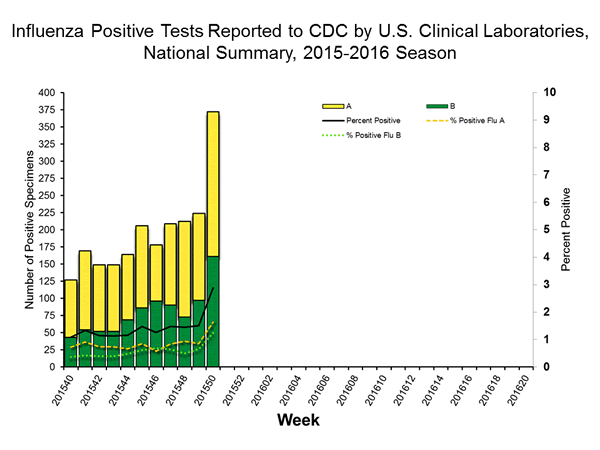
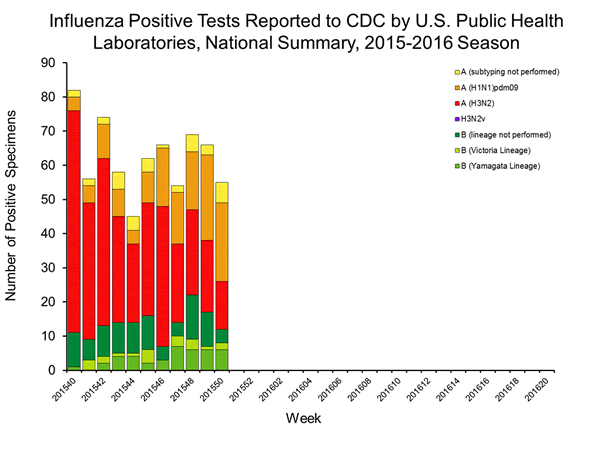
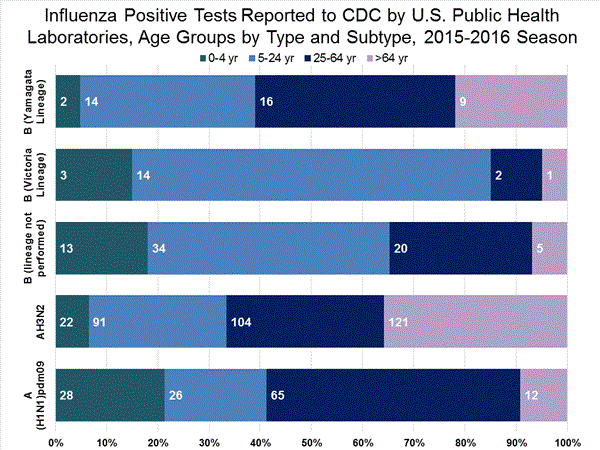
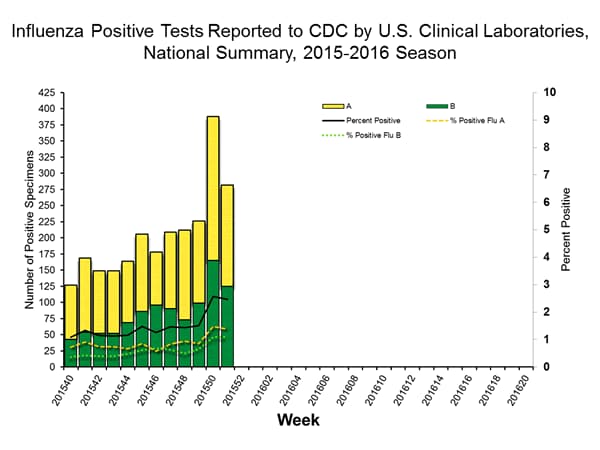
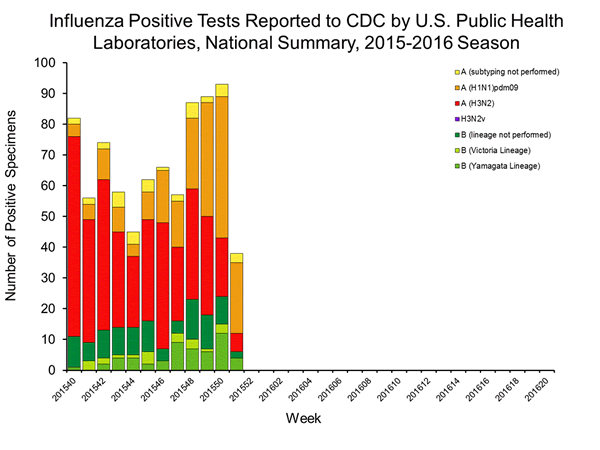
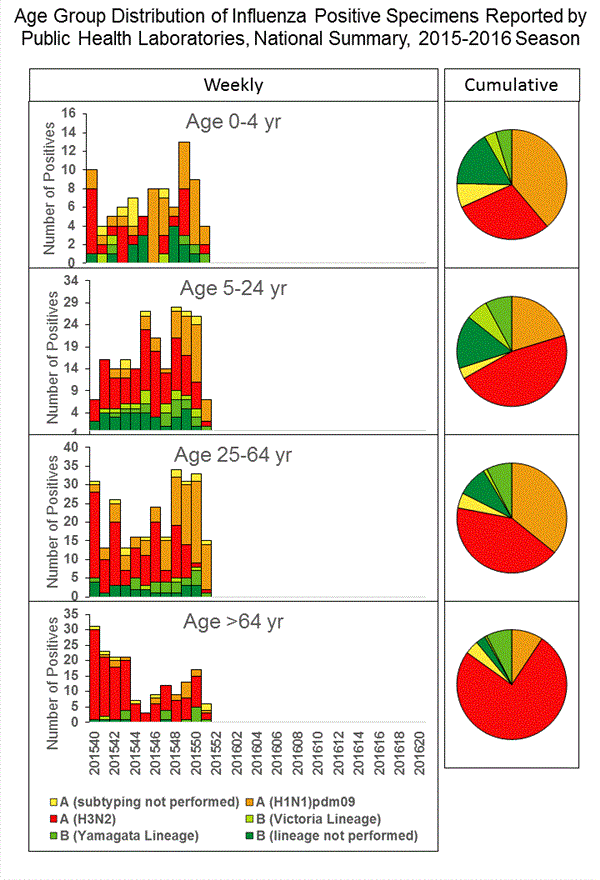
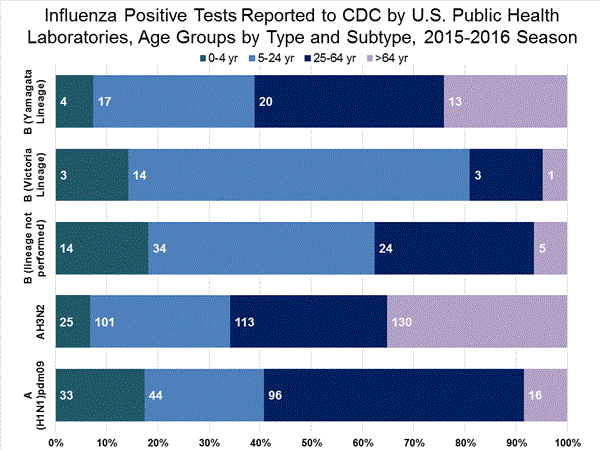
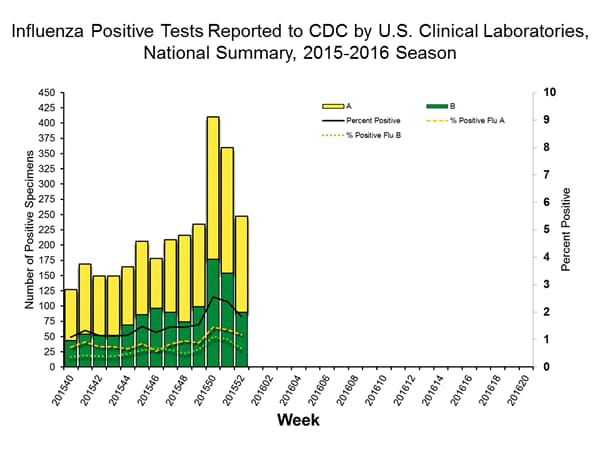
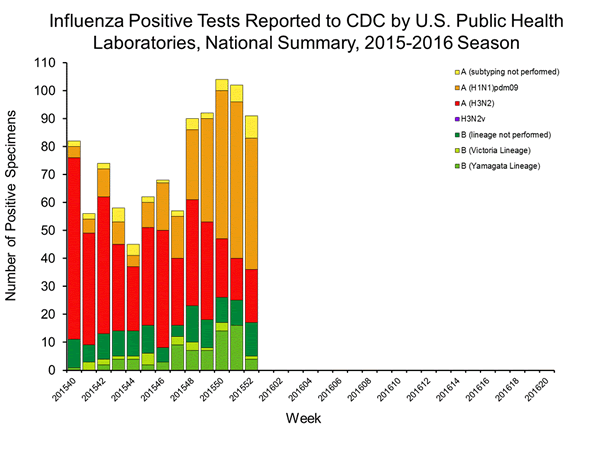
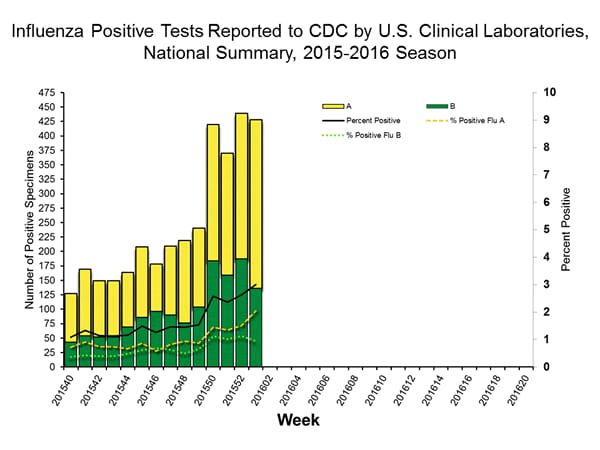
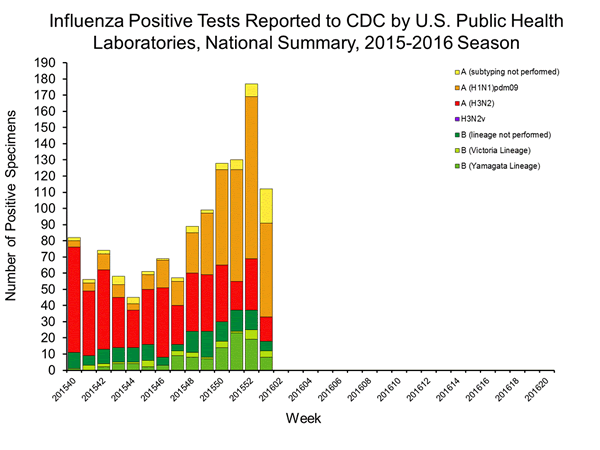
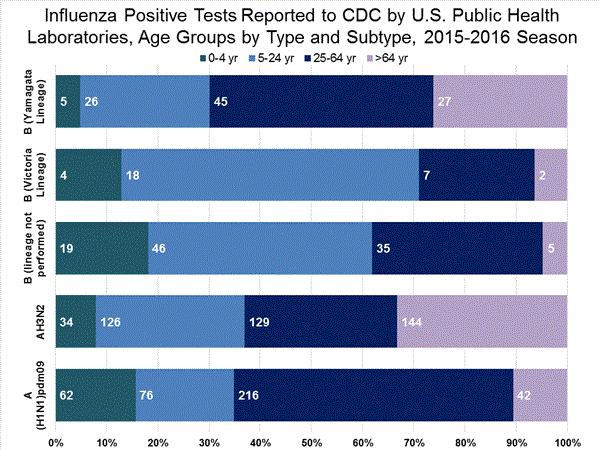
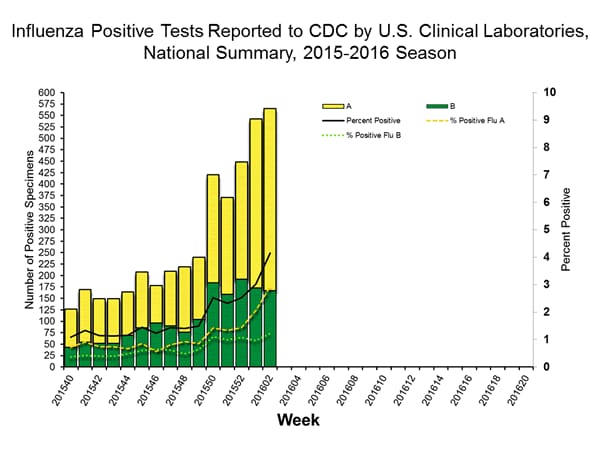
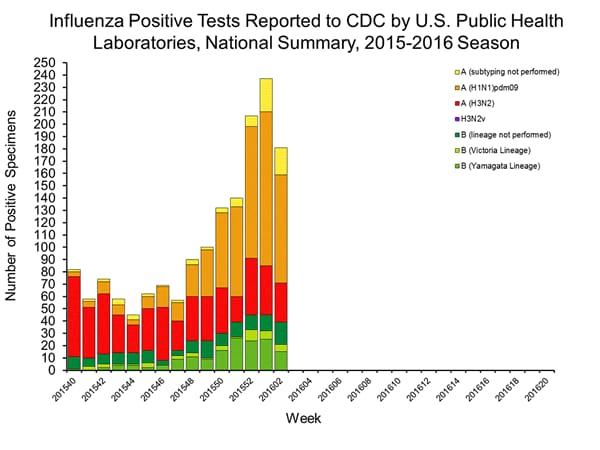
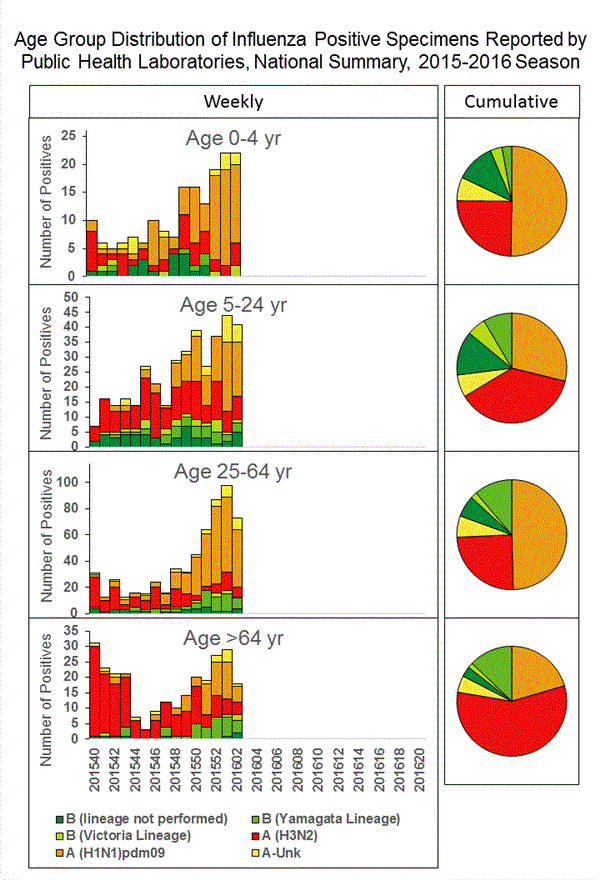
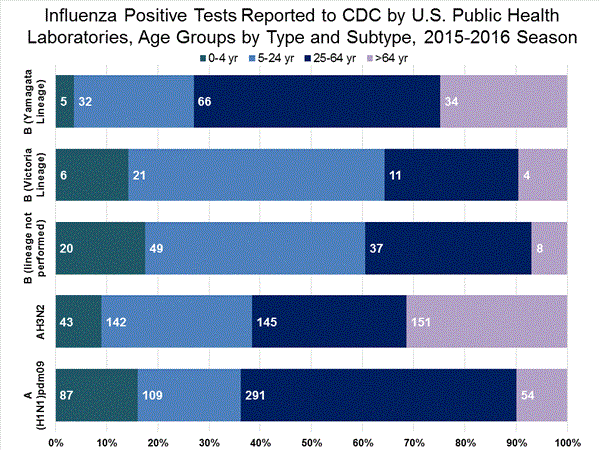
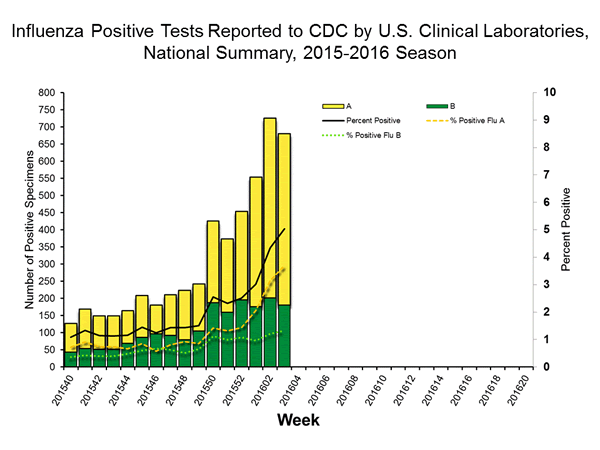
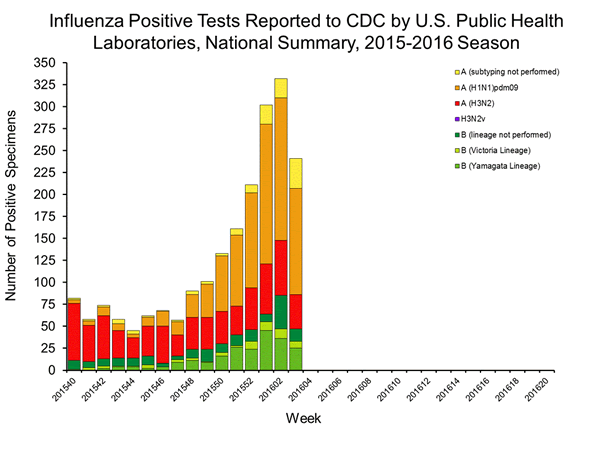
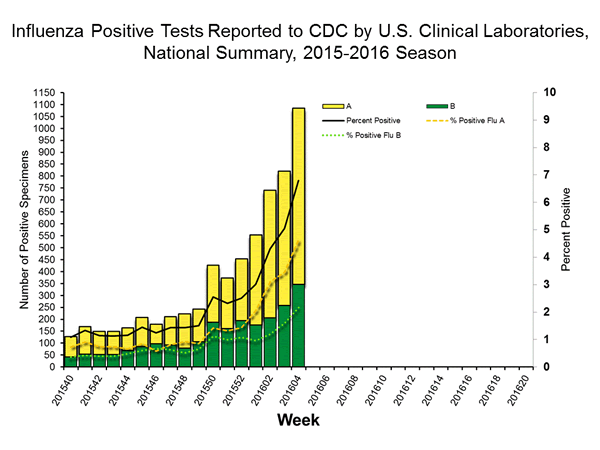
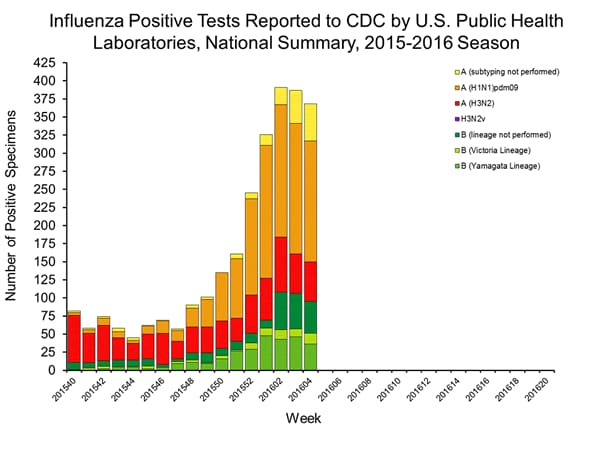
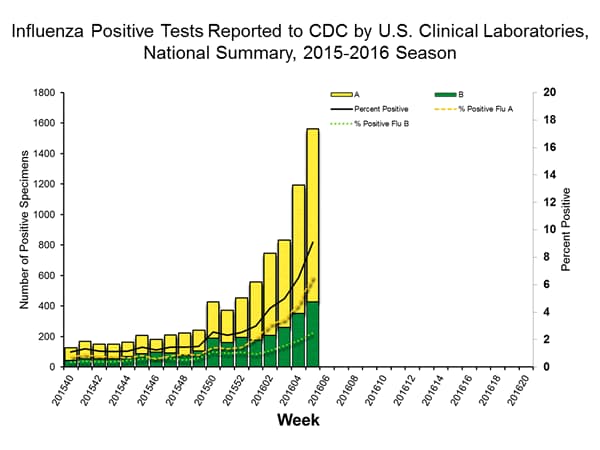
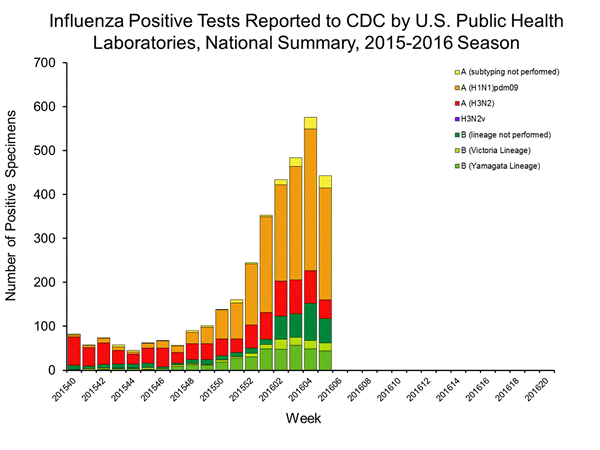
Viral Surveillance: The most frequently identified influenza virus type reported by public health laboratories in week 43 was influenza A viruses, with influenza A (H3) viruses predominating. The percentage of respiratory specimens testing positive for influenza in clinical laboratories is low.
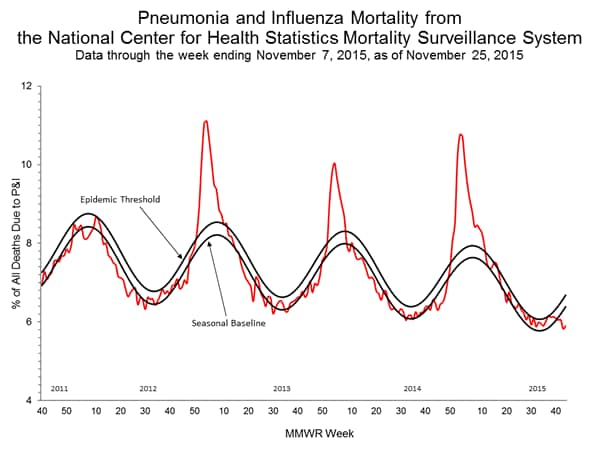
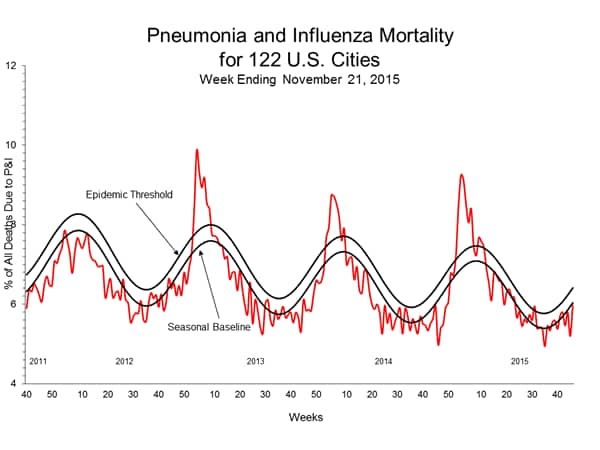
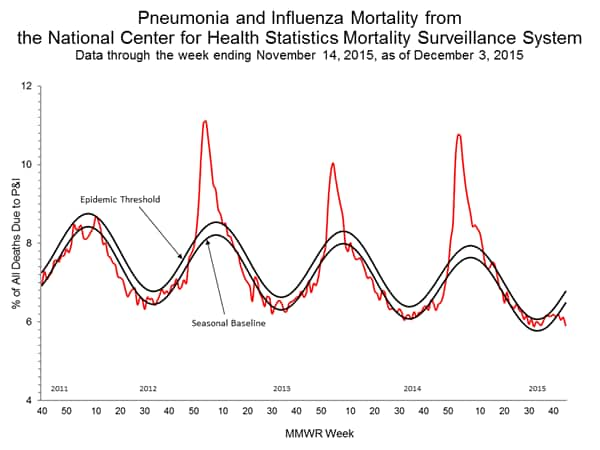
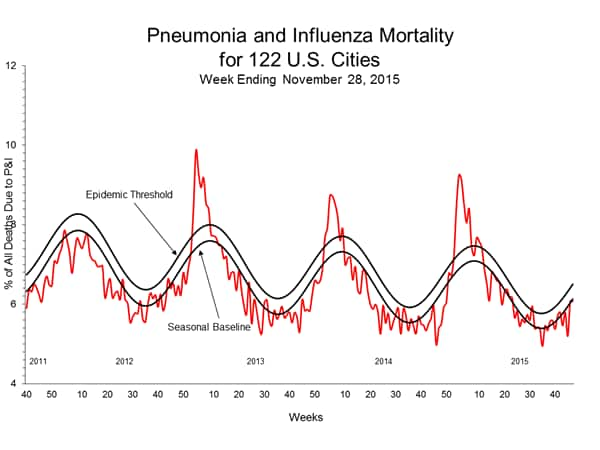
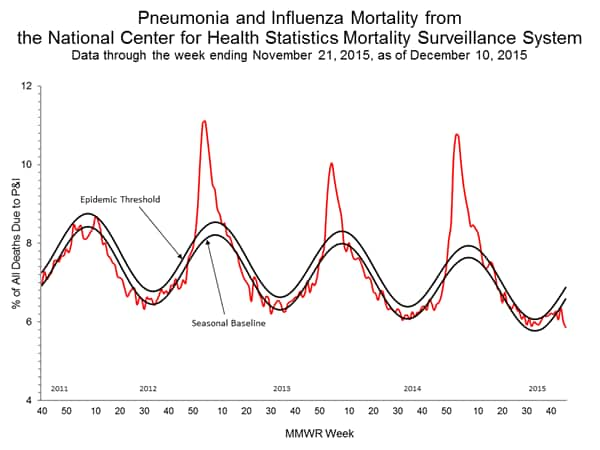
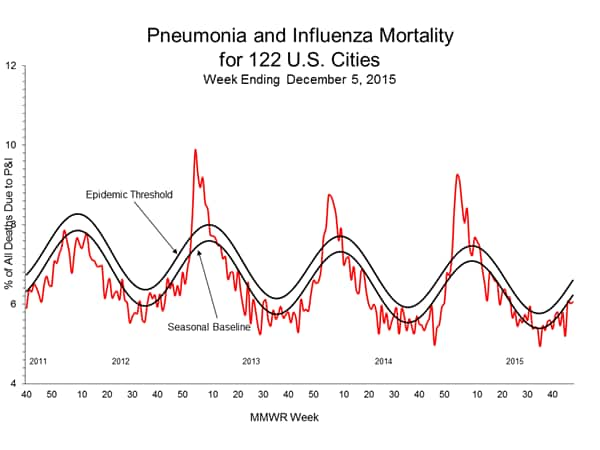
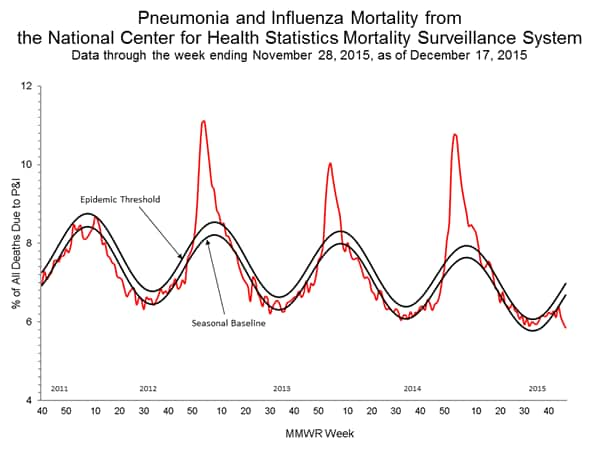
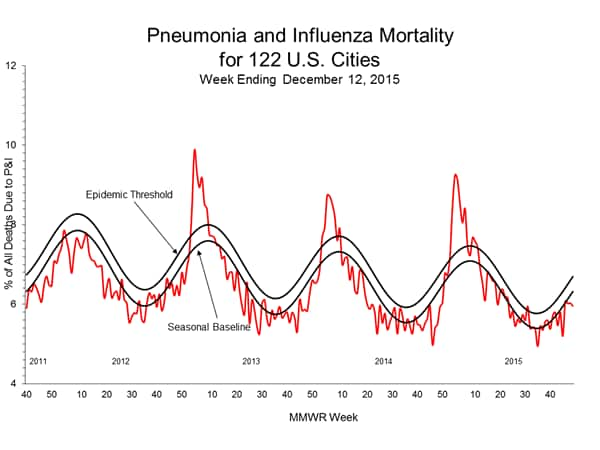
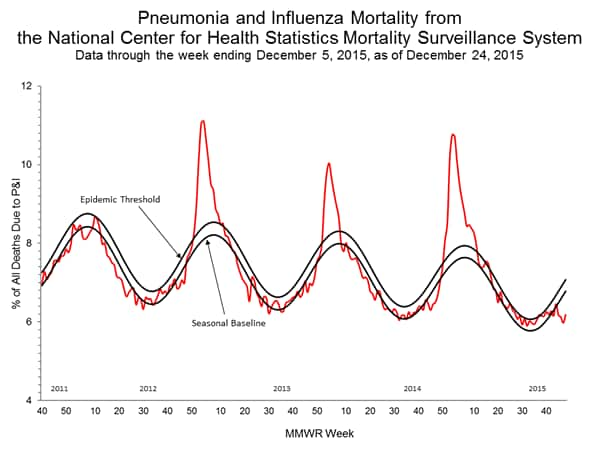
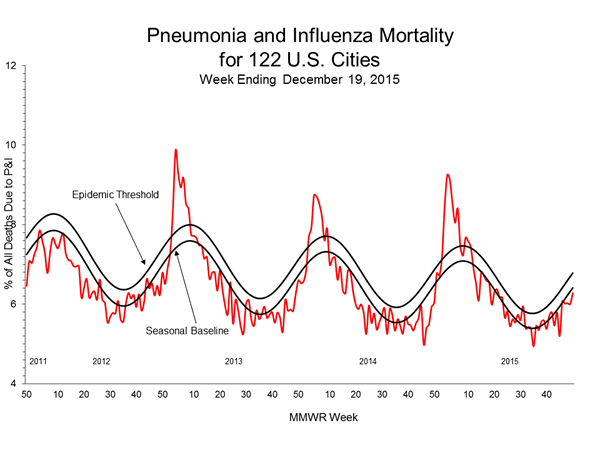
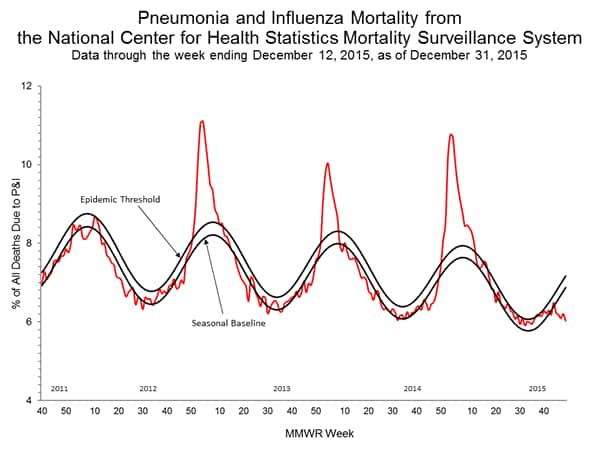
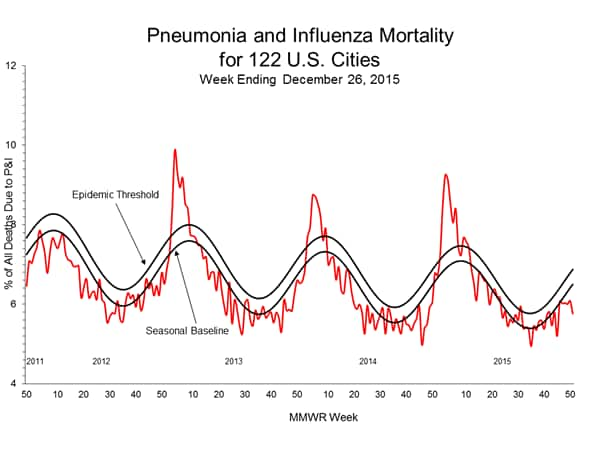
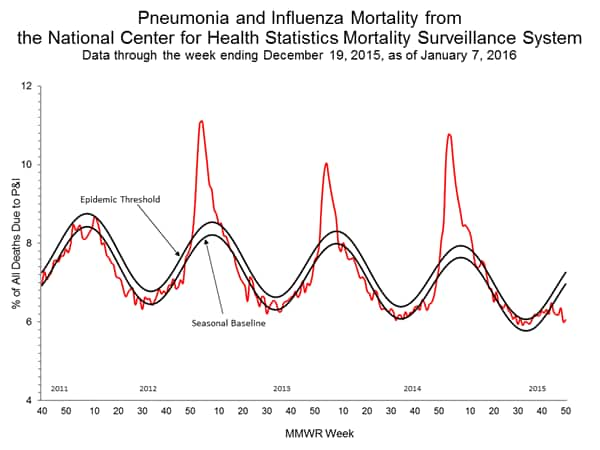
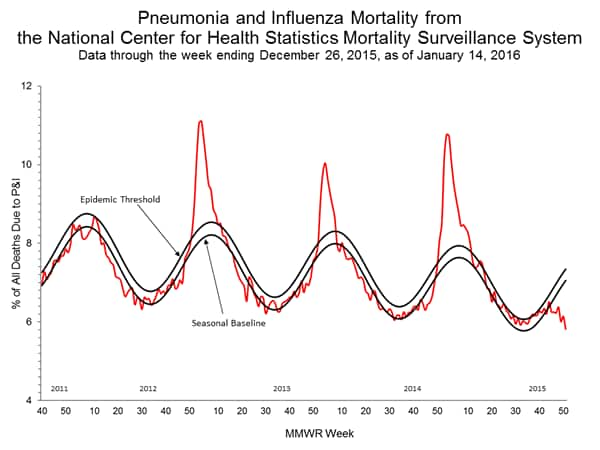
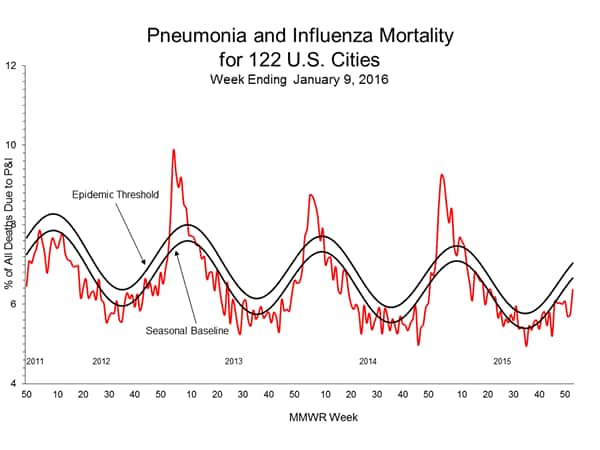
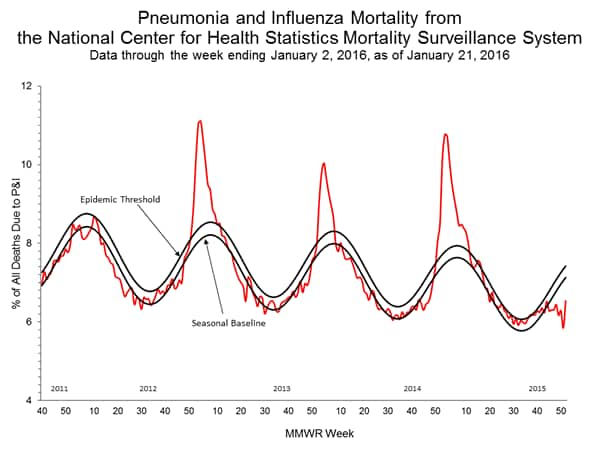
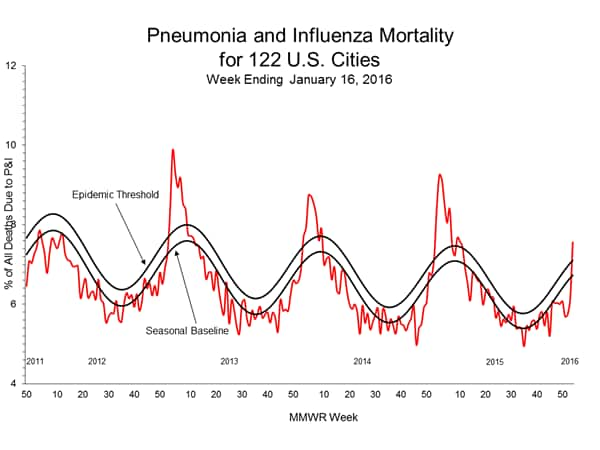
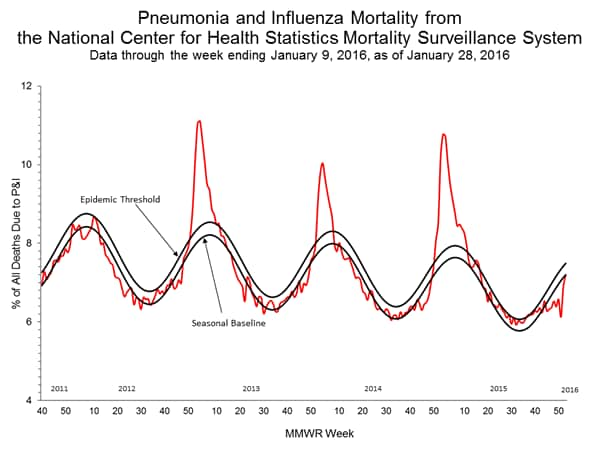
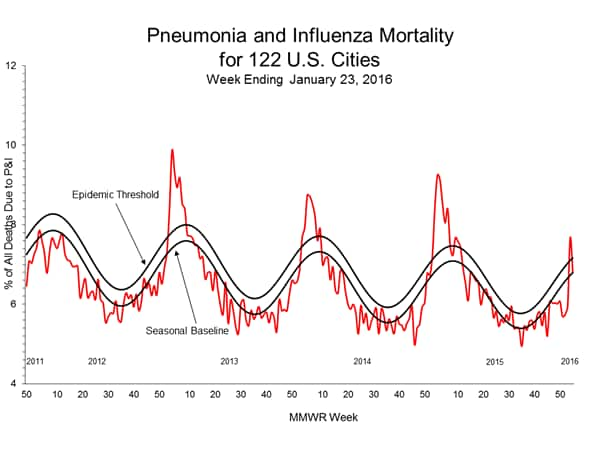
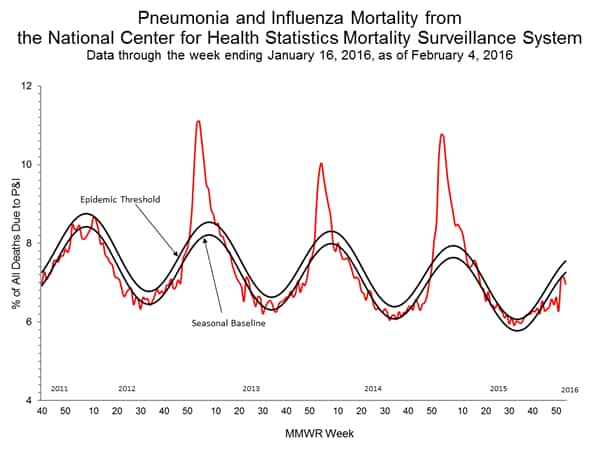
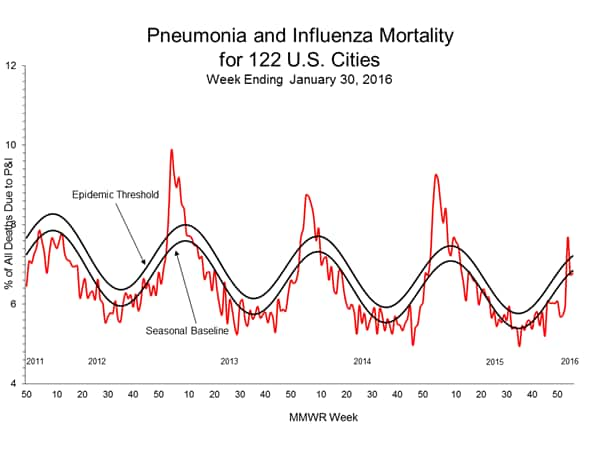
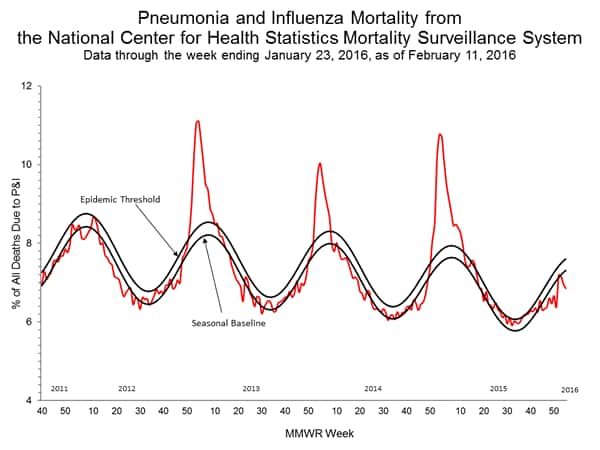
Pneumonia and Influenza Mortality: Based on NCHS mortality surveillance data available on November 5, 2015, 5.8% of the deaths occurring during the week ending October 17, 2015 (week 41) were due to P&I. This percentage is below the epidemic threshold of 6.4% for week 41. 122 Cities Mortality Reporting System: During week 43, 5.5% of all deaths reported through the 122 Cities Mortality Reporting System were due to P&I. This percentage was below the epidemic threshold of 6.1% for week 43.
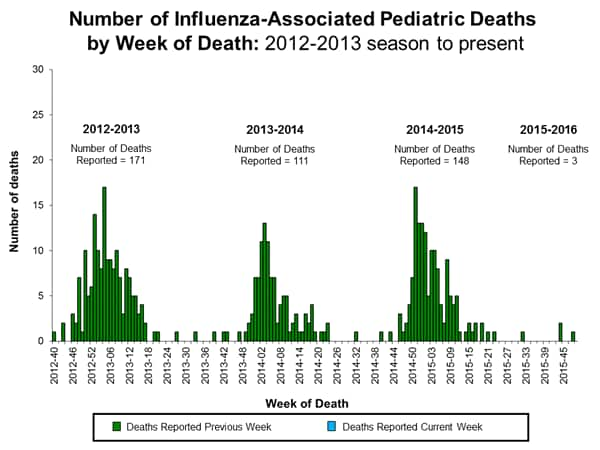
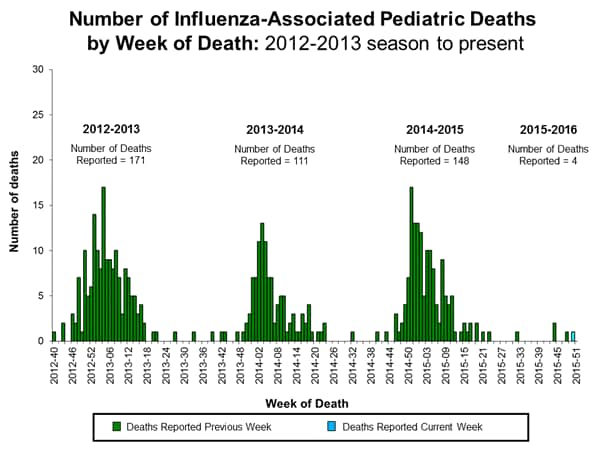
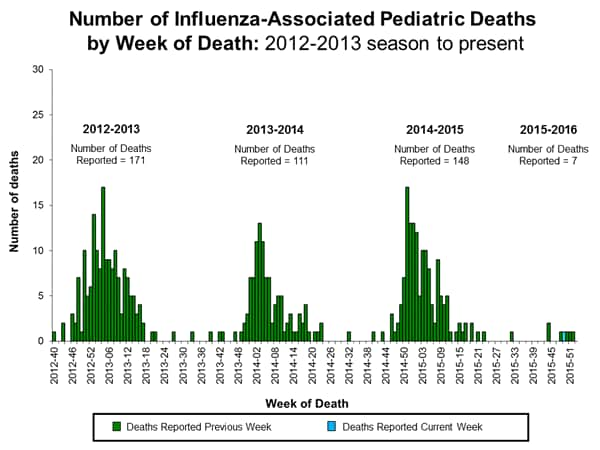
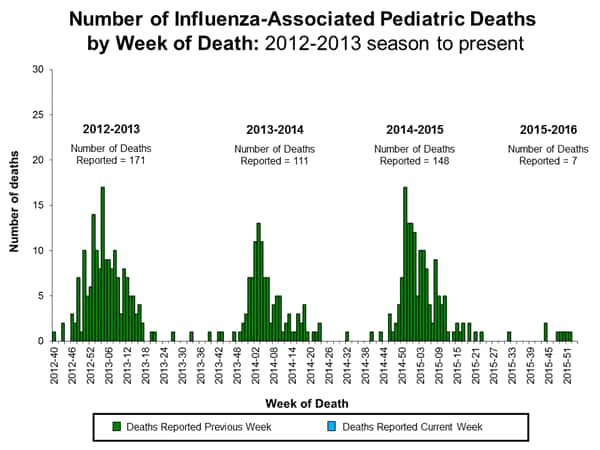
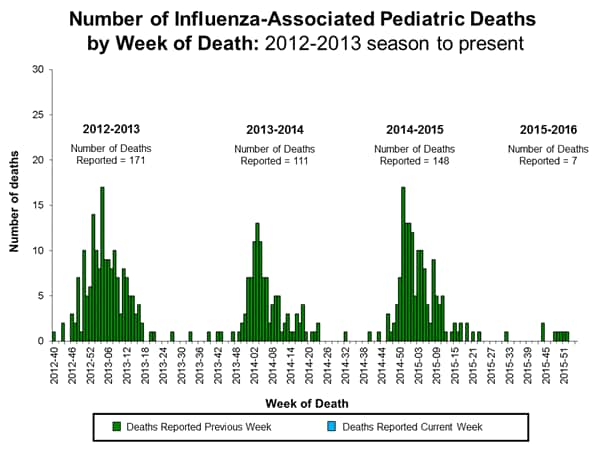
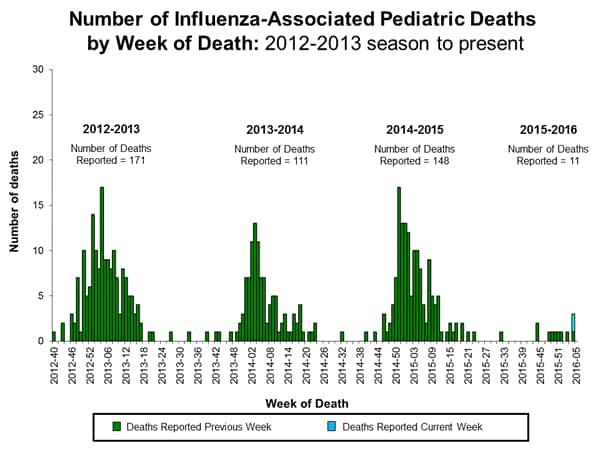
Influenza-associated Pediatric Deaths: No influenza-associated pediatric deaths were reported.
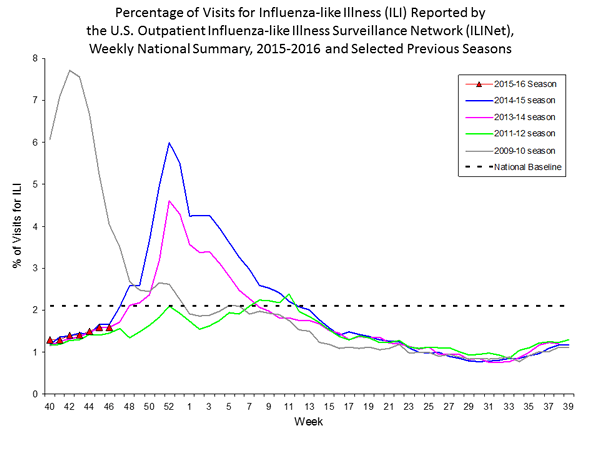
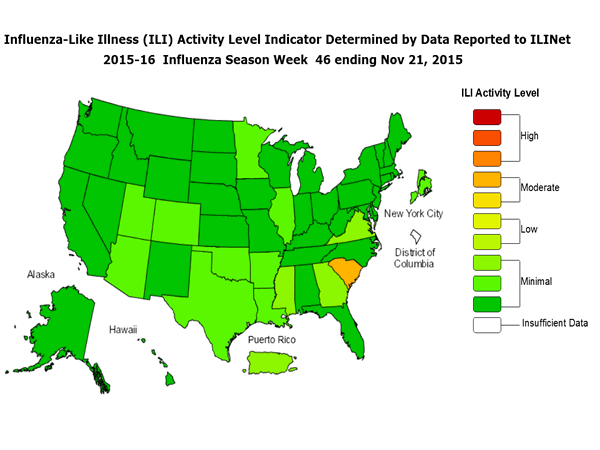
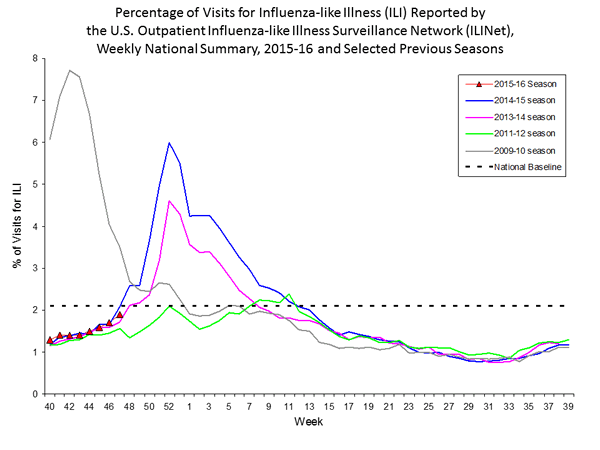
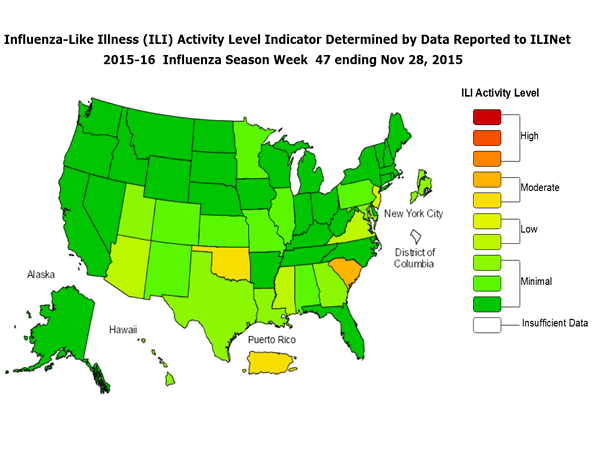
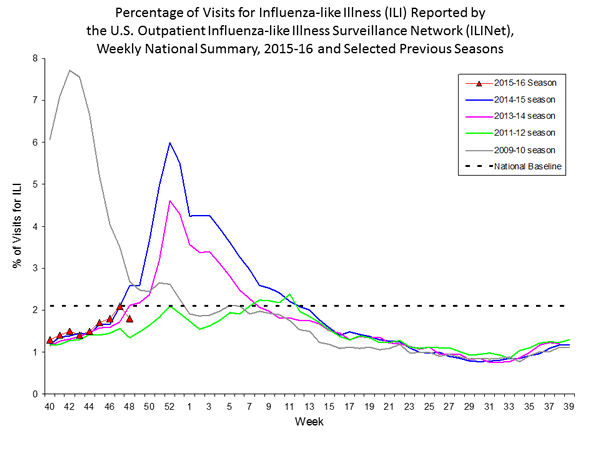
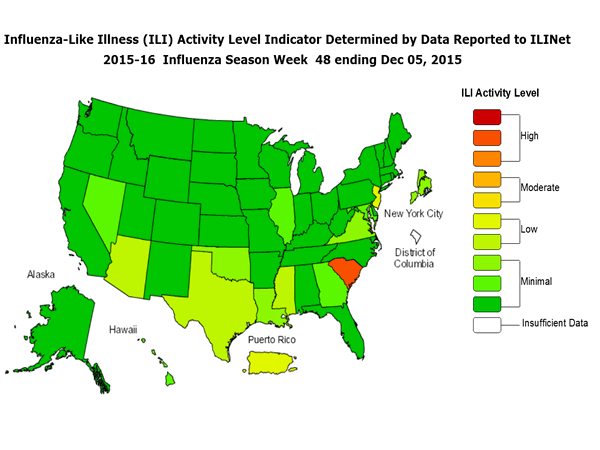
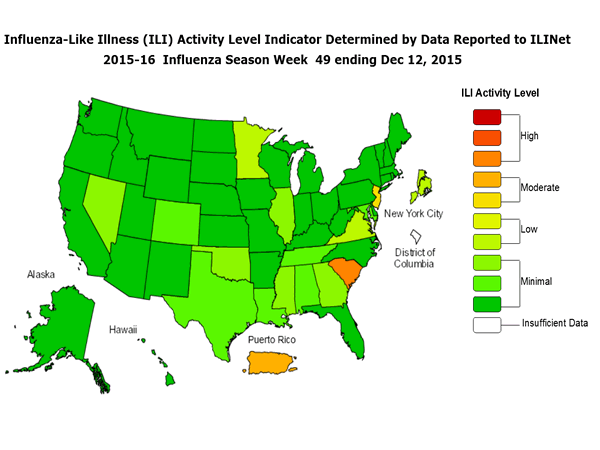
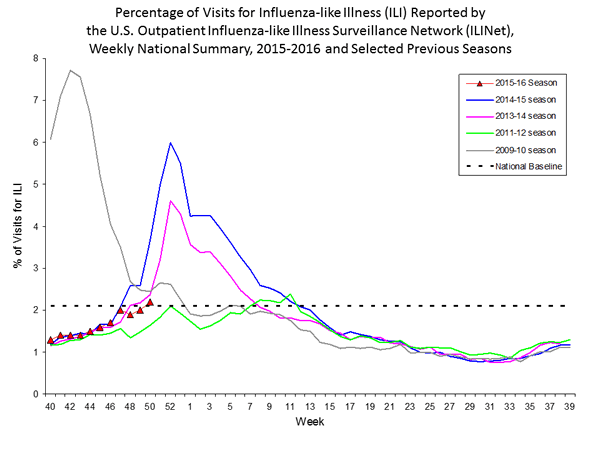
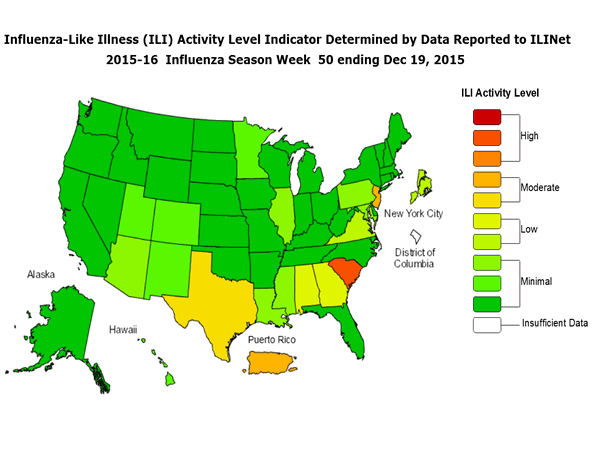
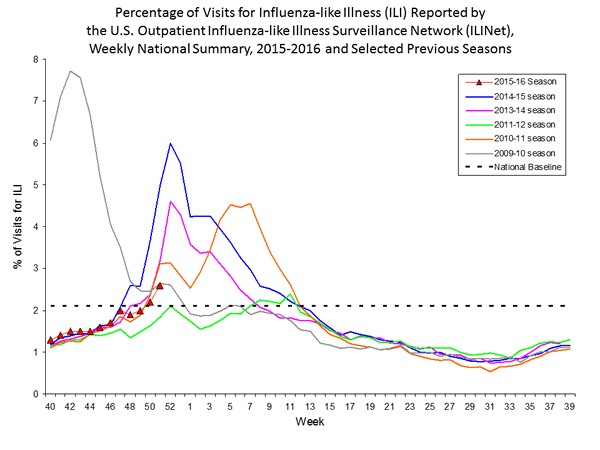
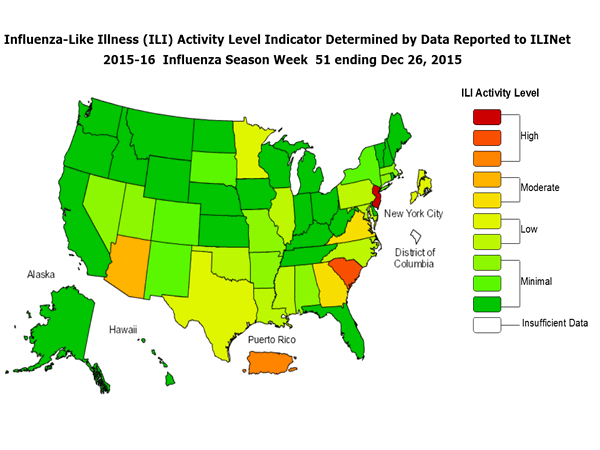
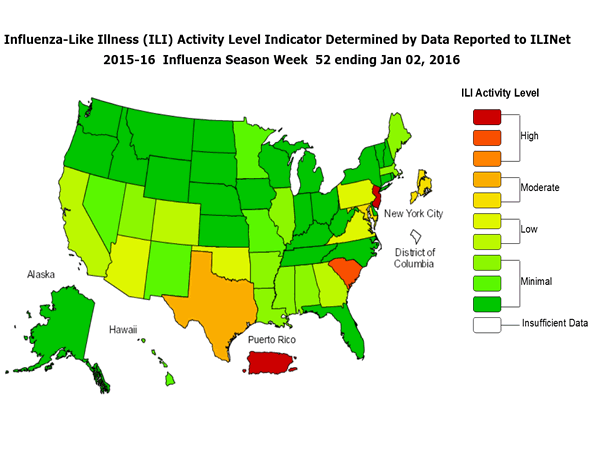
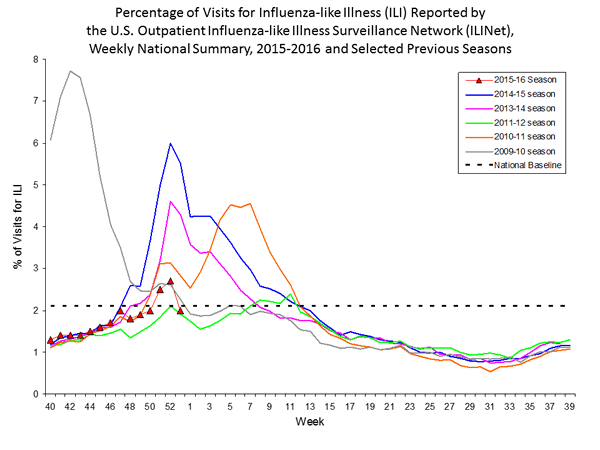
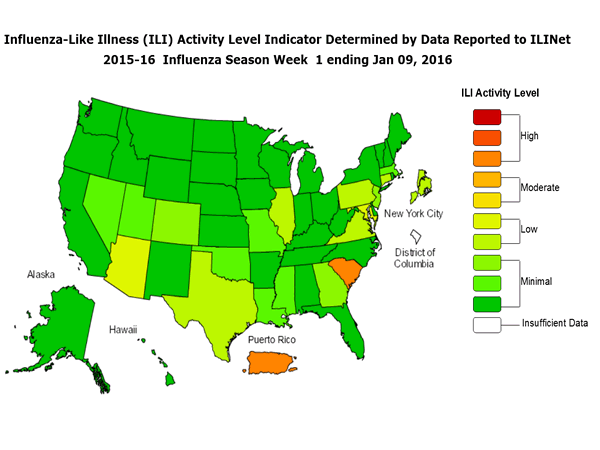
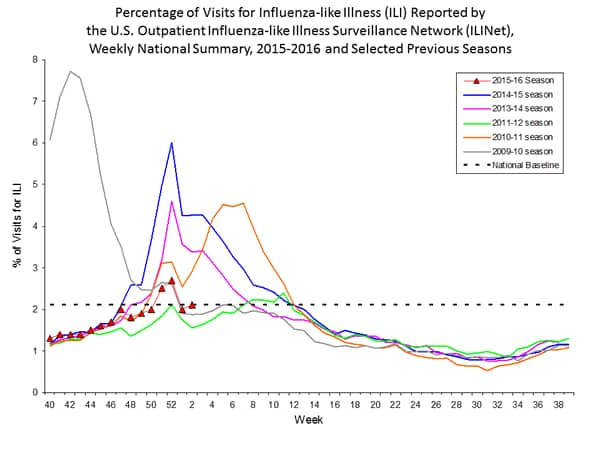
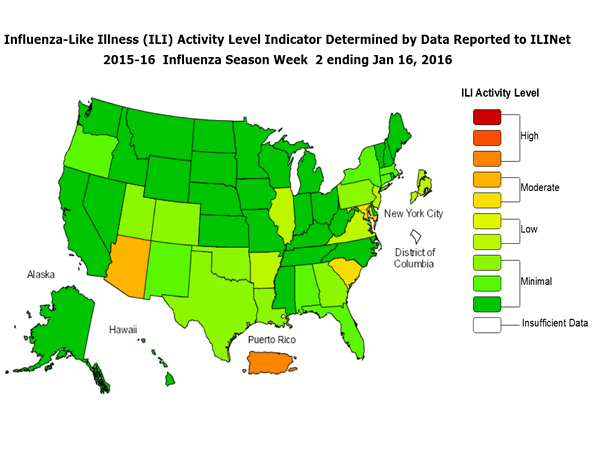
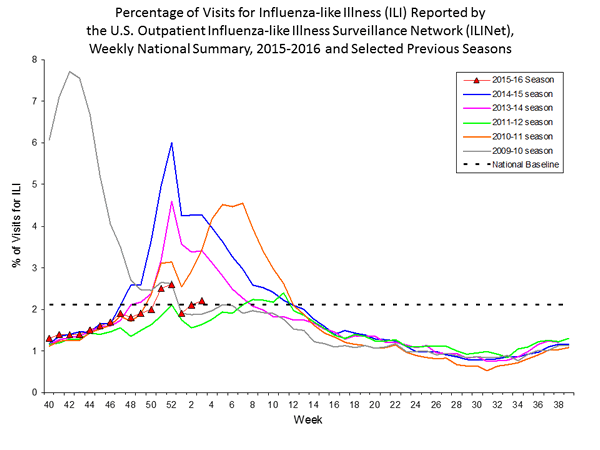
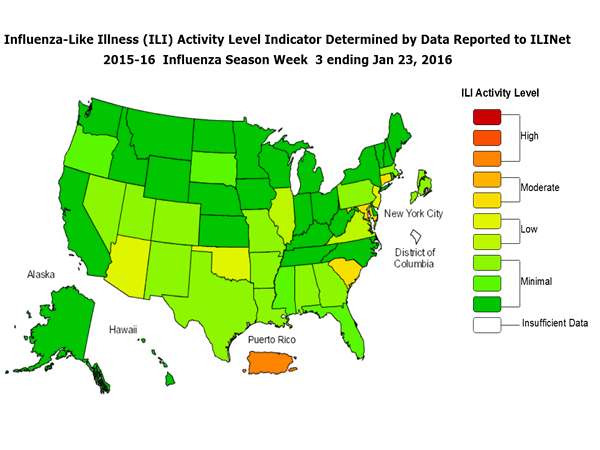
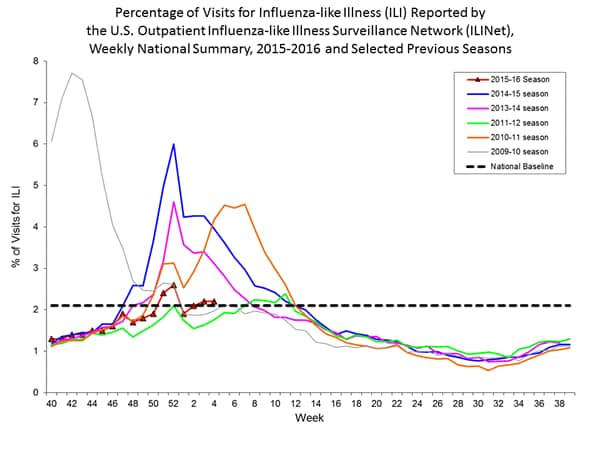
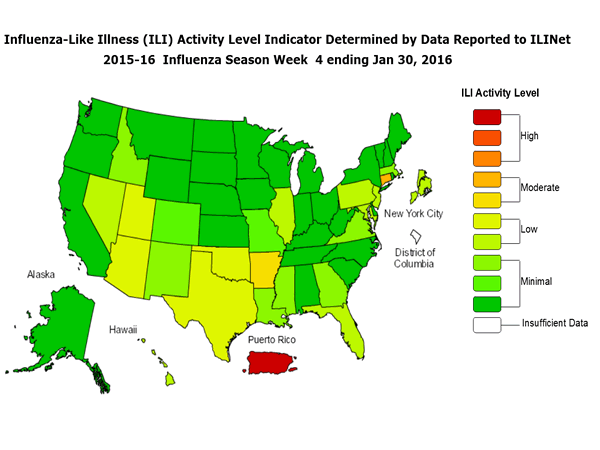
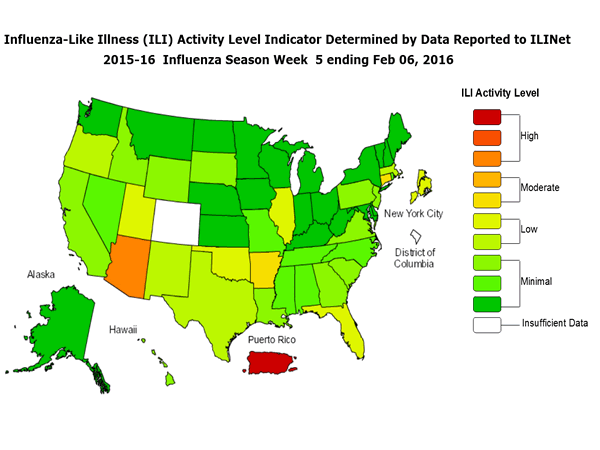
Outpatient Illness Surveillance: The proportion of outpatient visits for influenza-like illness (ILI) was 1.4%, which is below the national baseline of 2.1%. All 10 regions reported ILI below region-specific baseline levels. Puerto Rico experienced low ILI activity, New York City and 50 states experienced minimal ILI activity, and the District of Columbia had insufficient data.
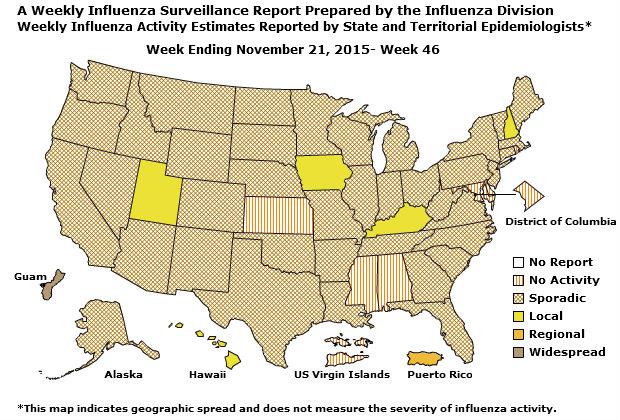
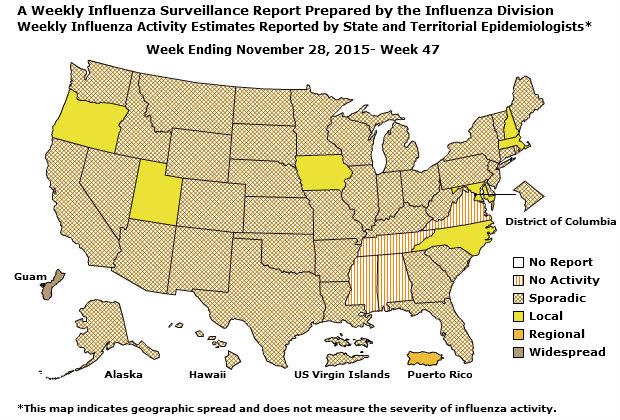
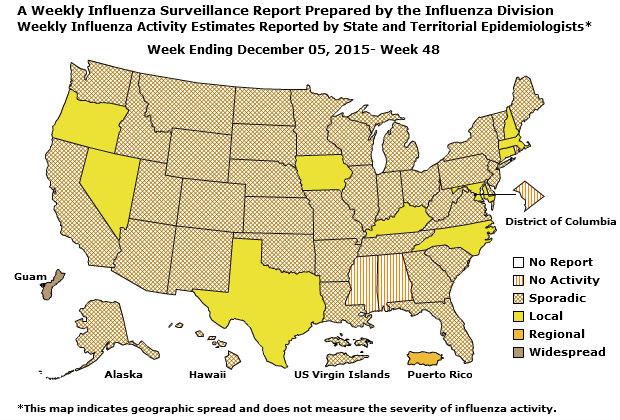
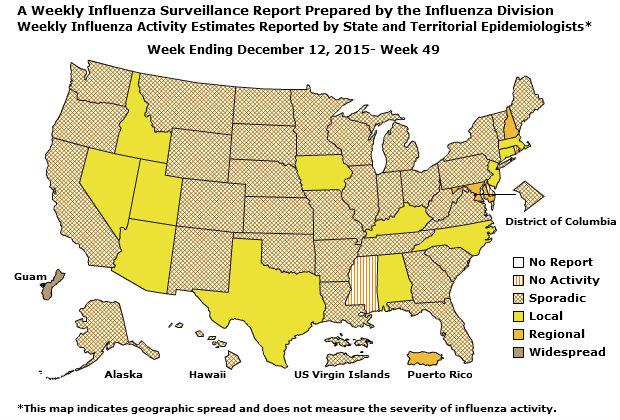
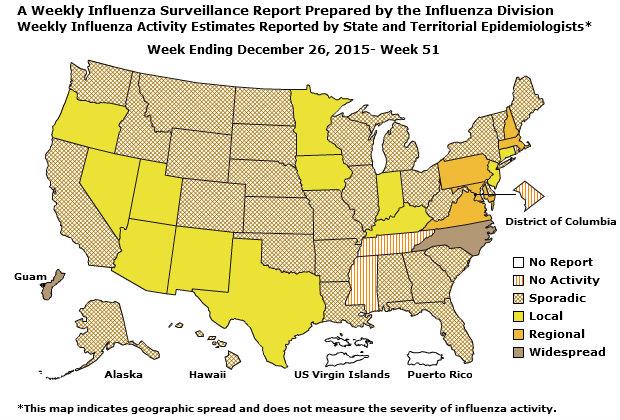
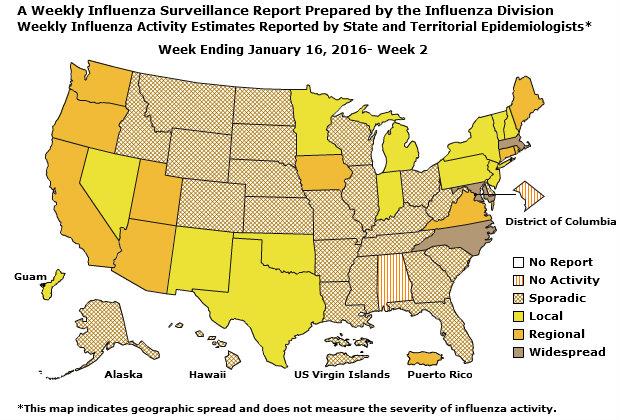
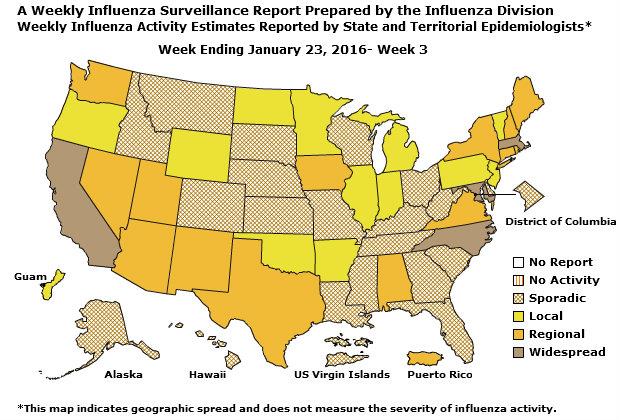
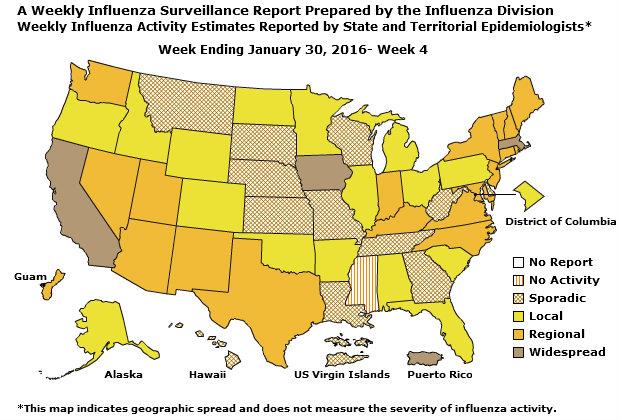
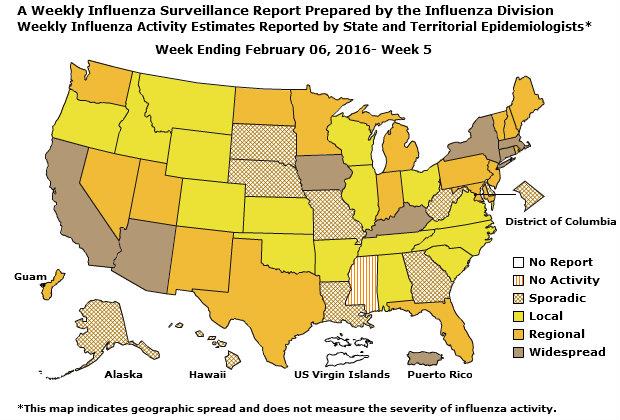
Geographic Spread of Influenza: The geographic spread of influenza in Guam was reported as regional; two states reported local activity; Puerto Rico and 40 states reported sporadic activity; and the District of Columbia, the U.S. Virgin Islands and eight states reported no influenza activity.
Outpatient Illness Surveillance: Nationwide during week 43, 1.4% of patient visits reported through the U.S. Outpatient Influenza-like Illness Surveillance Network (ILINet) were due to influenza-like illness (ILI). This percentage is below the national baseline of 2.1%.


Comment