Check out the FAQ,Terms of Service & Disclaimers by clicking the
link. Please register
to be able to post. By viewing this site you are agreeing to our Terms of Service and Acknowledge our Disclaimers.
FluTrackers.com Inc. does not provide medical advice. Information on this web site is collected from various internet resources, and the FluTrackers board of directors makes no warranty to the safety, efficacy, correctness or completeness of the information posted on this site by any author or poster.
The information collated here is for instructional and/or discussion purposes only and is NOT intended to diagnose or treat any disease, illness, or other medical condition. Every individual reader or poster should seek advice from their personal physician/healthcare practitioner before considering or using any interventions that are discussed on this website.
By continuing to access this website you agree to consult your personal physican before using any interventions posted on this website, and you agree to hold harmless FluTrackers.com Inc., the board of directors, the members, and all authors and posters for any effects from use of any medication, supplement, vitamin or other substance, device, intervention, etc. mentioned in posts on this website, or other internet venues referenced in posts on this website.
We are not asking for any donations. Do not donate to any entity who says they are raising funds for us.
Announcement
Collapse
No announcement yet.
Weekly MMWR (2010-11): Weeks 40-39 (No Pediatric Deaths)
8,45% is a big spike.
In the last season the highest was 8.3
Analyzing mortality by age groups, 45-64 seems to be the group that most contribute to the spike
I was pretty shocked. If the increase is due to pH1N1, then it could go higher, much higher, since pH1N1 is just becoming dominant in the Southeast, starting its upward trend in the Northeast and Midwest, and barely detected west of the Rockies.
8,45% is a big spike.
In the last season the highest was 8.3
Analyzing mortality by age groups, 45-64 seems to be the group that most contribute to the spike
"I know God will not give me anything I can't handle. I just wish that He didn't trust me so much." - Mother Teresa of Calcutta
Is there a specific way of finding out the break down of ages for deaths. Although there seems to be much Influenza, I wonder which one is the real killer. By the post above, Jim, and thanks for all your great graphs for the States, it looks like Florida is kind of peaked and coming down, as you said and very similiar with other states. The overall death total would be interesting at this point. I just do not know where to go on this forum yet.
Thank you for help. Very Informative forum. Will let you know that I live in California and we know many that have had flu, however, they are not going to MD. They are riding it out. So not sure if California stats are right. We had so many deaths last year.
Pacific: 10.8%
New England: 10.3%
S Atlantic: 8.7%
ES Central: 8.5%
WN central 8.3%
Mountain: 8.1%
EN Central: 8.1%
Mid-Atlantic 7.0%
WS Central: 6.8%
@ Jeff - The weekly mortality report breaks the overall fatalities into broad age based catagories, but does not do so for the Pneumonia and Influenza deaths. Confirmed flu deaths are tracked by age on some of the State reports but not all. MissouriWatcher does a spectacular job keeping those threads updated each week - but the data provided is often very incomplete.
The CDC does provide a weekly Fluview report that details the ages of confirmed hospitalized cases (purple and white table about half way down this link http://www.cdc.gov/flu/weekly/index.htm ) It also has gender and virus type information. Unfortunately it does not provide the extra dimension of correlating virus type to age group. I still assume that H1N1 affects under 65's more, but there is a lack of US based data this year.
Twitter: @RonanKelly13
The views expressed are mine alone and do not represent the views of my employer or any other person or organization.
Testing results in the UK indicate that pH1N1 still predominantly affects <65. However, it was disturbing to learn (and I can't recall the numbers exactly), but at one point England reported 17 Influenza B deaths and the rest were pH1N1. But, there were at least twice that number (35-40) deaths of people >65, which could indicate that it has mutated away from the immunity that the older population had from a similar virus many years ago. If so, we might see fatalities in the coming weeks increase in that age group, along with younger people. I really hope I'm wrong, but based on the data, I believe that a mutated pH1N1 will peak near the end of the month and prior infection or vaccination might not prevent people from getting it.
Originally posted by RoRo;391018The CDC does provide a weekly Fluview report that details the ages of confirmed hospitalized cases (purple and white table about half way down this link [url
http://www.cdc.gov/flu/weekly/index.htm[/url] ) It also has gender and virus type information. Unfortunately it does not provide the extra dimension of correlating virus type to age group. I still assume that H1N1 affects under 65's more, but there is a lack of US based data this year.
"I know God will not give me anything I can't handle. I just wish that He didn't trust me so much." - Mother Teresa of Calcutta
"Seven of the 13 deaths reported were associated with influenza A (H3) virus infection, four deaths were associated with influenza B virus infection, and two were associated with an influenza A virus for which the subtype was not determined."
Today, Fluview will list the new six deaths and associated influenza. This should be the most telling, considering 2009 A(H1N1) is now moving to the forefront, although AZ Department of Health listed their pediatric death as A/H3.
Some states breakdown adult deaths. So far, few have been 2009 A(H1N1).
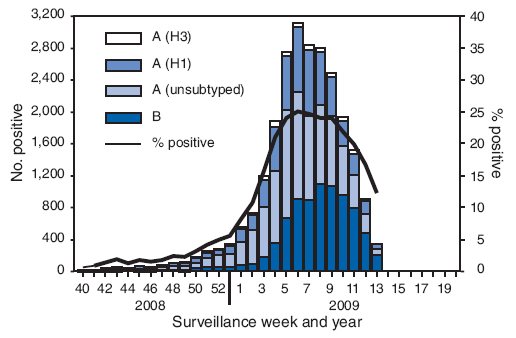
Given that the 2009-2010 flu season was an anomaly, I looked at 2008-2009 for comparision. It appears that week 6 is the height of the traditional flu season:
We will have to see what happens next week to draw any conclusions about the trend.
This year's curve might turn out to be odd - with either a double hump or a protracted peak. The reason I say this is that states that have experienced very high %ILI have mostly not seen much pH1N1. As seasonal flu drops, it seems that pH1N1 increases.
Given that the 2009-2010 flu season was an anomaly, I looked at 2008-2009 for comparision. It appears that week 6 is the height of the traditional flu season:...
We will have to see what happens next week to draw any conclusions about the trend.
This year's curve might turn out to be odd - with either a double hump or a protracted peak. The reason I say this is that states that have experienced very high %ILI have mostly not seen much pH1N1. As seasonal flu drops, it seems that pH1N1 increases.
Sure. That is possible. I thought I would post a graph of a "normal" year on this thread so that we can more easily compare.
Re: Weekly MMWR (2010-11): Weeks 40-6 (Five New Pediatric Deaths)
NOTE: I have revised some of original data after finding updates
Looking back on previous seasons (from final reports in Fluview) I found that: http://www.cdc.gov/flu/weekly/pastreports.htm
Nationally (when P&I deaths exceeded threshold):
1. ~4 weeks after peak PP (percent positive), P&I deaths reach peak
2. Peak ILI and peak PP often occur in the same week
3. When PP is >30, ILI peak is ~6-8% (1999-00, 03-04, 07-08, 09-10)
Below are flu seasons where P&I exceeded threshold. Peak PP (percent positives), peak ILI (week that they occurred) and week of peak P&I deaths: 1999-00 peaks: 33PP and 6% ILI (week 51); 11.2% P&I (week 3) 2001-02 peaks: 25.9PP and 3.2%ILI (week 8); 9.1% P&I (week 11) 2003-04 peaks: 35.2PP (week 49/51) and 7.6% ILI (week 52); 10.3% P&I (week 2) 2004-05 peaks: 27PP (week 5) and 5.4%ILI (week 7) and 8.9%P&I (week 9) A(H3N2) viruses predominated but influenza A(H1N1), A(H1N2) and B viruses also circulated 2007-08 peaks: 32PP and 6%ILI (week 7); 9.1% P&I (week 11) 2009-10 peaks: 38.09PP and 7.7%ILI (week 42); 8.2% P&I (week 46)
Current season, up until week 4, A/H3N2 had been the most predominant virus.
Here's what a study that CDC has listed states:
"The MMWR study found that during seasons when influenza A (H3N2) viruses were prominent death rates were more than double what they were during seasons when influenza A (H1N1) or influenza B viruses predominated. In addition, the study confirmed previous findings that about 90% of influenza associated deaths occur among adults 65 years and older.
Does CDC think that influenza causes most P&I deaths?
No, only a small proportion of deaths in either of these two categories are estimated to be influenza-related. CDC estimated that only 8.5% of all pneumonia and influenza deaths and only 2.1% of all respiratory and circulatory deaths were influenza-related." http://www.cdc.gov/flu/about/disease...ted_deaths.htm
"During the seasons (1997-98, 1998-99, and 1999-2000), the peak percentages of respiratory specimens testing positive for influenza viruses ranged from 28% to 32%...the peak percentage of patient visits for ILI ranged between 5% and 7%." (P&I thresholds were exceeded).http://www.cdc.gov/flu/weekly/weekly...-01summary.htm
Seasons where P&I didn't exceed threshold:
2000-01 peaks: 24PP and 4% ILI; A(H3N2) viruses did not predominate
2002-03 peaks: 24.7 PP and 3.2% ILI; 8.3% P&I; A(H1N1), A(H1N2) and B viruses circulated widely, and the predominant virus varied by region and time of season
2005-06 peaks: 22.7PP(week 7) and 3.3%ILI (week 52), 3.2%ILI (week 9); A(H3N2) viruses predominated overall, but late in the season influenza B viruses
2006-07 peaks: 28PP (week 6) and 3%ILI (week 52), 3.5%ILI (week 7) and P&I ~7.7% (peaked 3 times) A (H1) viruses were most commonly isolated. One case of human infection with swine influenza virus was reported.
2008-09 peaks: 42.8PP (week 24) and 5.1% ILI and rising (week 39) *This was an odd season, perhaps data is still being entered.
 Tweet
Tweet


Comment