 Tweet
Tweet
Subscribe to the Weekly Review
Interpretive Summary for May 20, 2022
It’s Time for a Boost

For the week ending May 20, 2022, cases and hospitalizations continued to rise as the United States marked one million deaths from COVID-19. While about 54% of the U.S. population is experiencing low COVID-19 Community Levels, many areas have moved into medium and high levels. COVID-19 Community Levels can help communities and individuals make decisions based on their local context and their unique needs.
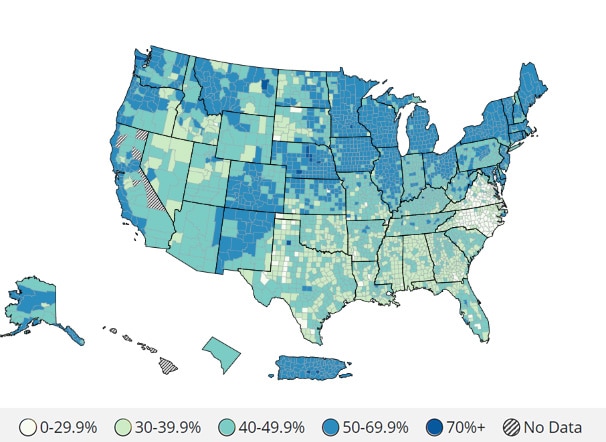
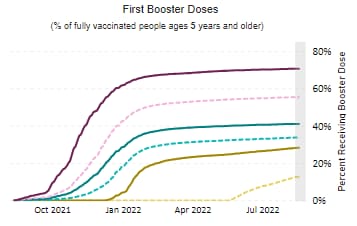
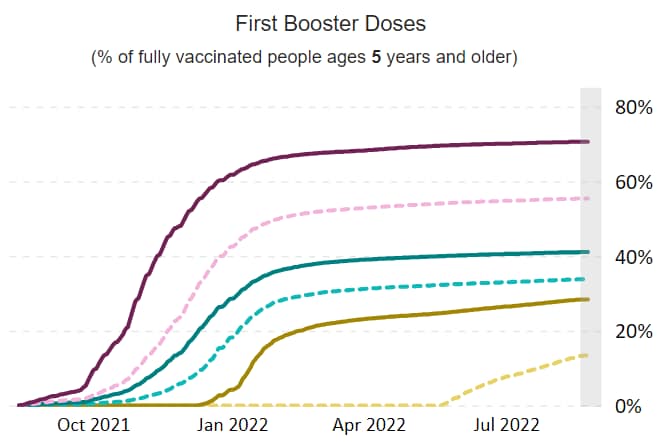
COVID-19 vaccination remains the best option to lower your risk of severe illness, hospitalization, and death if you get infected. Many people have started vaccination, but most have not stayed up to date. About 78% of people in the United States have received at least one dose of a COVID-19 vaccine, and 66.5% are fully vaccinated. Of those who are fully vaccinated, 46.4% have received a booster and are considered up to date. Everyone ages 5 years and older is eligible to receive one booster after receiving their COVID-19 vaccine primary series. Some people are eligible to receive a second booster.
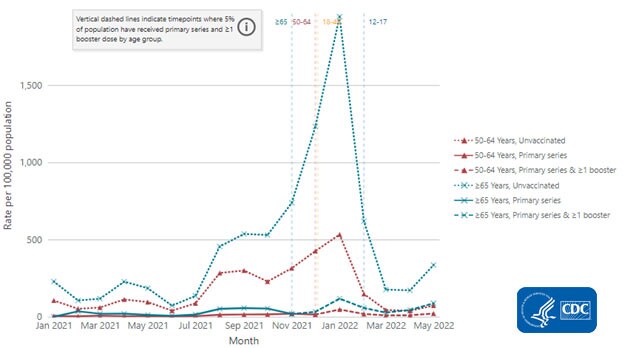
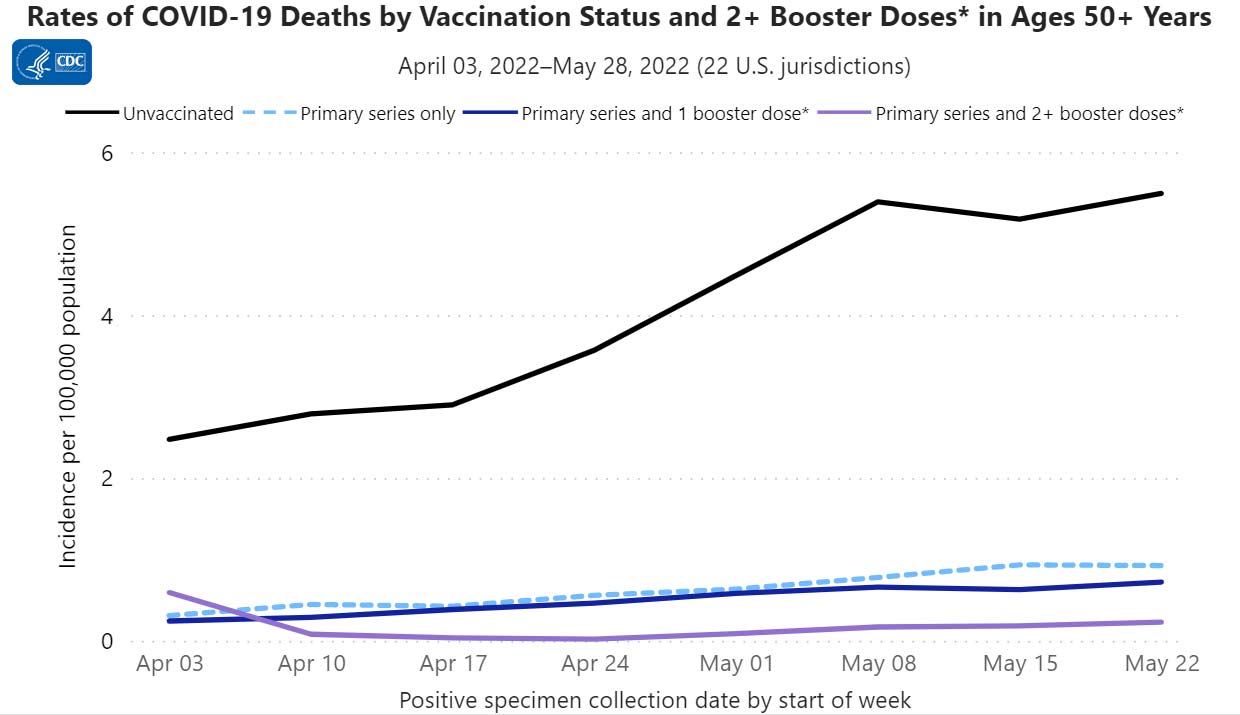
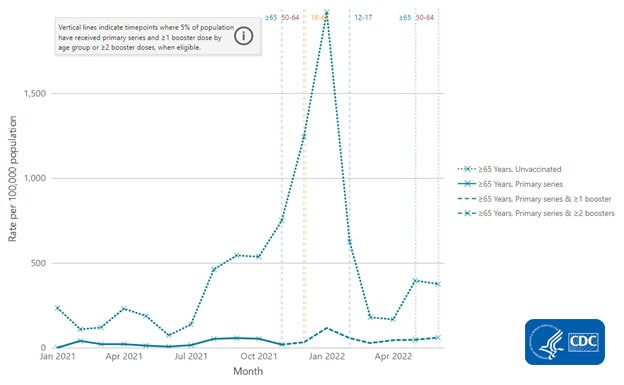
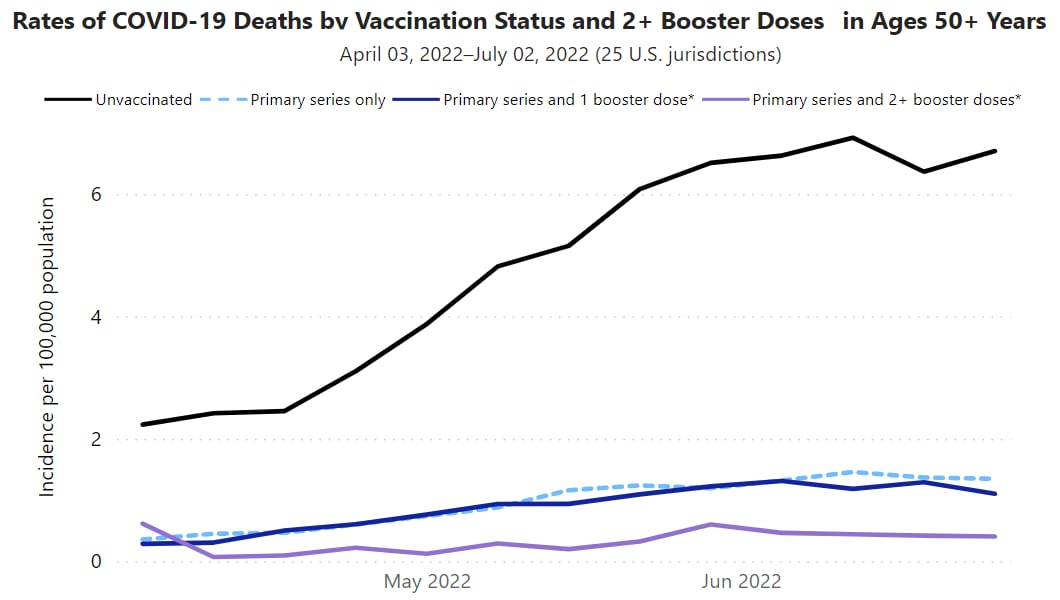
People who are up to date on vaccines have much lower risk of serious illness and death from COVID-19 compared with people who are unvaccinated. CDC’s COVID Data Tracker shows that in March 2022, adults ages 18 years and older who were unvaccinated were about 5 times more likely to be hospitalized with COVID-19 than those who were up to date. In the same month, people ages 12 years and older and unvaccinated were 17 times more likely to die of COVID-19 than those who were up to date.
COVID-19 vaccines available in the United States are effective at protecting people from getting seriously ill, being hospitalized, and even dying—especially people who are boosted. As with other diseases, you are protected best from COVID-19 when you stay up to date with recommended vaccines. Find a vaccine provider near you.
Note to Readers: CDC will not publish the COVID Data Tracker Weekly Review on Friday, May 27, 2022. The Weekly Review will resume publication on Friday, June 3, 2022. To find all the latest COVID-19 data, visit COVID Data Tracker.
What's New
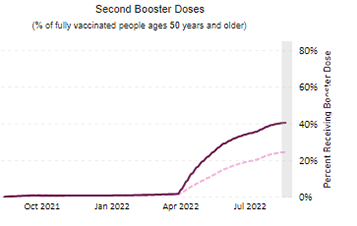
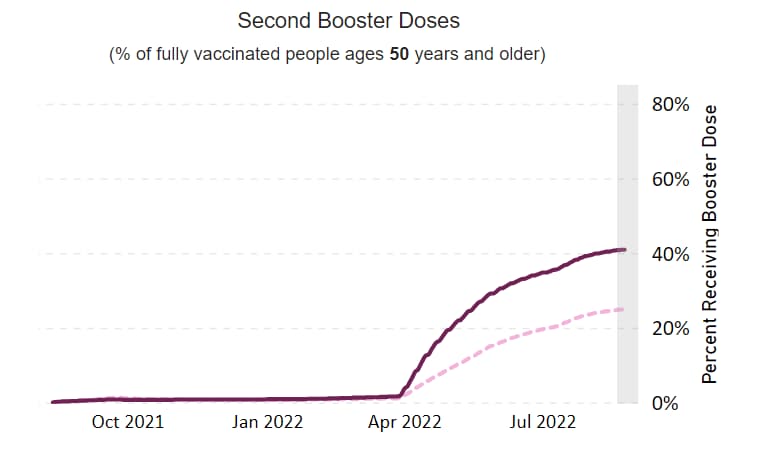
- COVID Data Tracker’s Vaccinations in the US tab now displays the count and percent of the populations ages 50 years and older and 65 years and older who have received a second booster dose, nationally and by jurisdiction. This tab also includes a new chart of the number of people in the United States with a second booster dose, by vaccine type.
- COVID Data Tracker’s Cases and Deaths by Vaccination Status tab is now updated with case data through April 23, 2022, and death data through April 2, 2022.
- Effectiveness of a COVID-19 Additional Primary or Booster Vaccine Dose in Preventing SARS-CoV-2 Infection Among Nursing Home Residents During Widespread Circulation of the Omicron Variant — United States, February 14–March 27, 2022
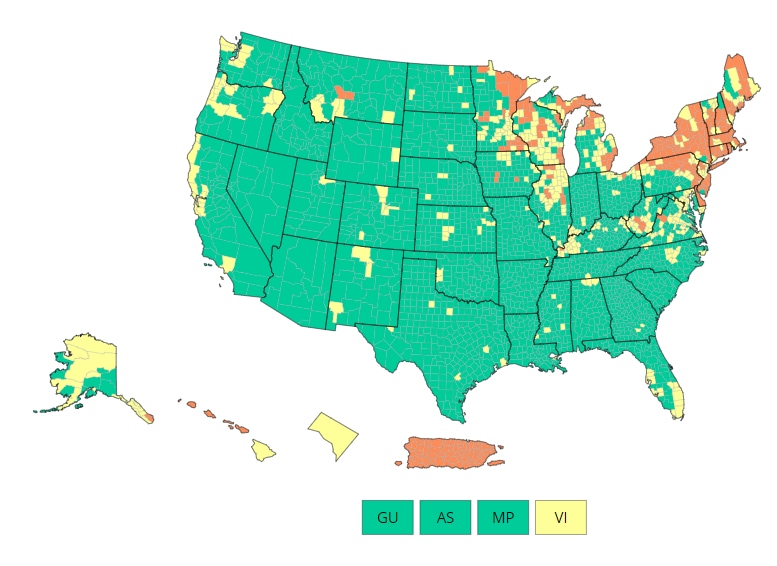
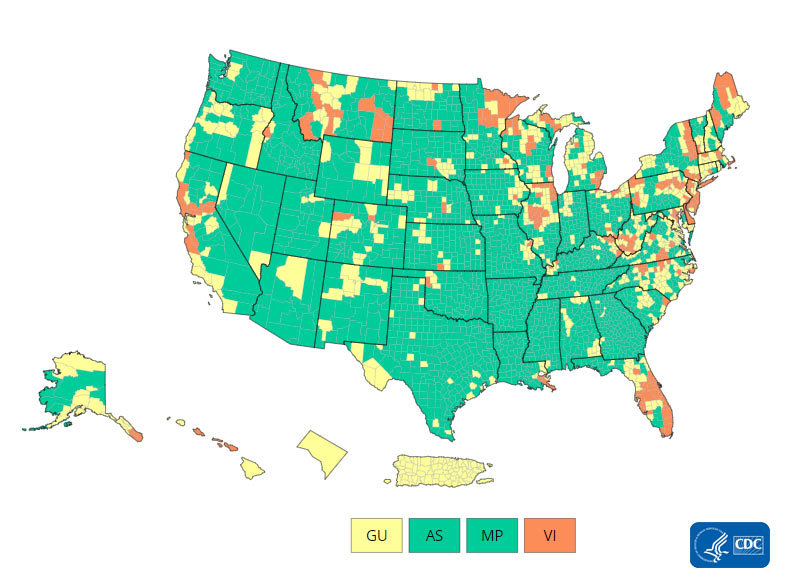
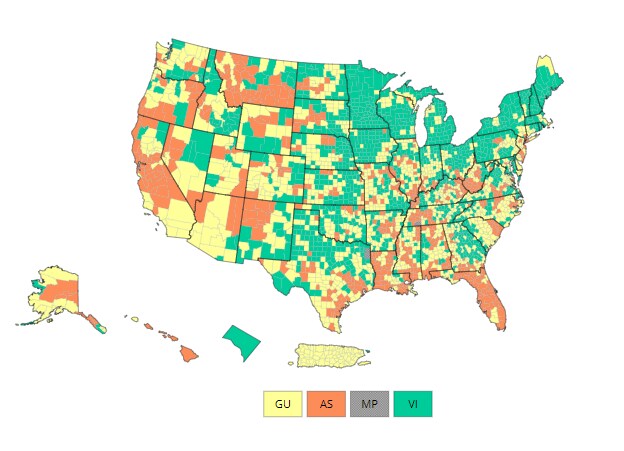
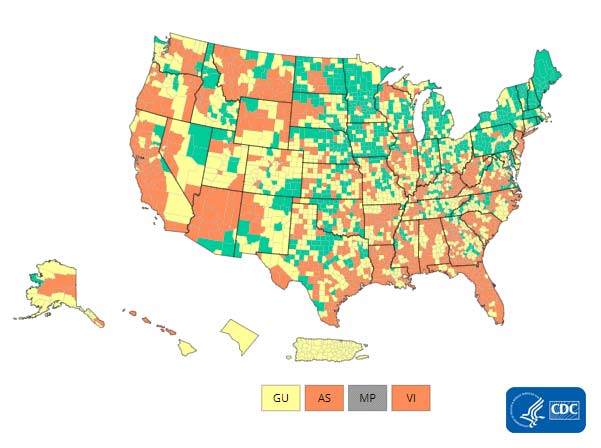
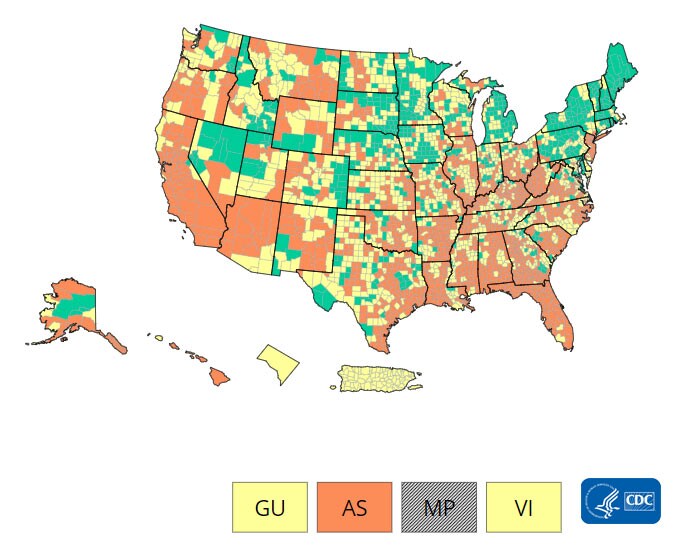
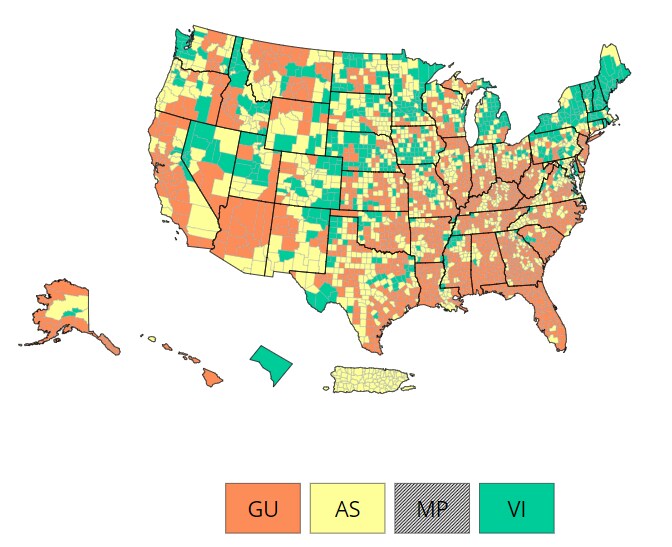
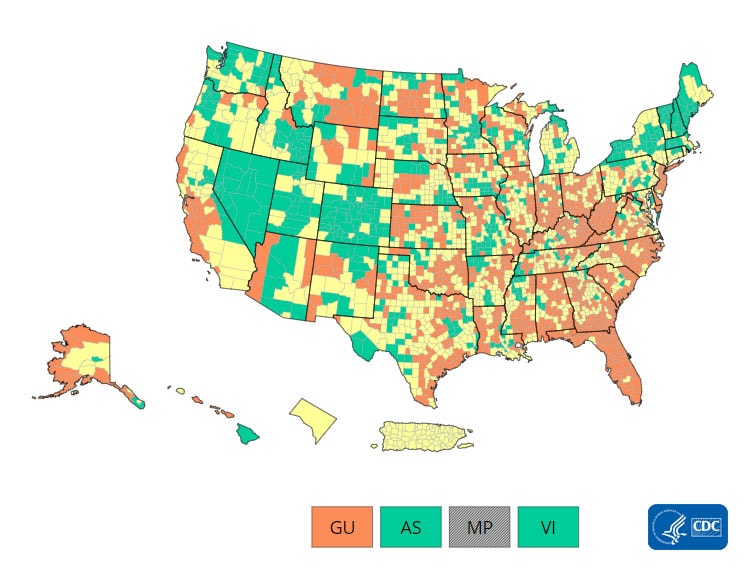
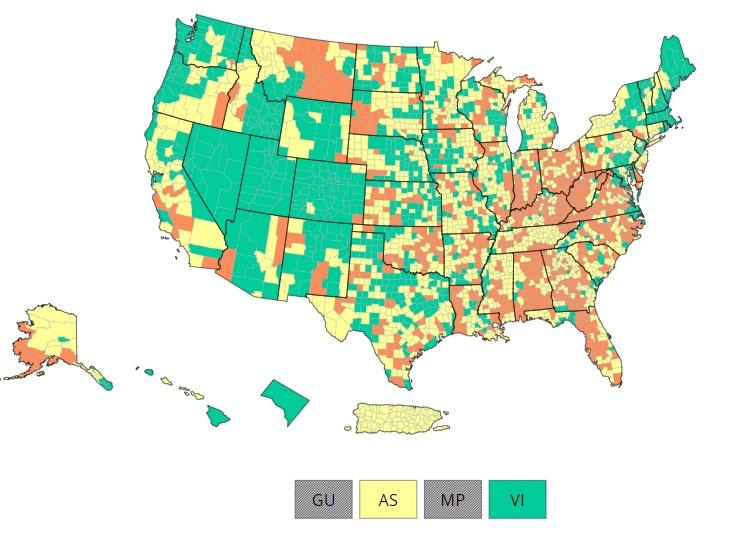
COVID-19 Community Levels
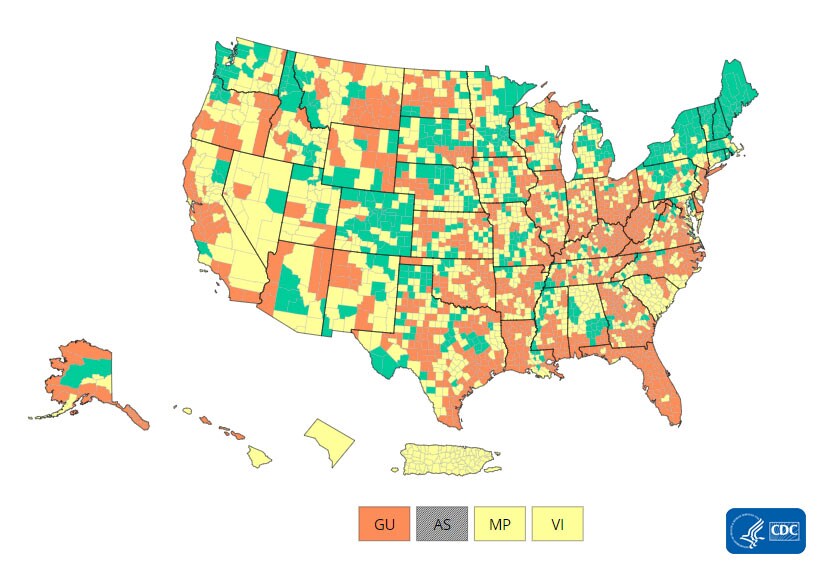
As of May 19, 2022, there are 301 (9.35%) counties, districts, or territories with a high COVID-19 Community Level, 477 (14.81%) counties with a medium Community Level, and 2,442 (75.84%) counties with a low Community Level. This represents a moderate (+5.10 percentage points) increase in the number of high-level counties, a slight (−0.74 percentage points) decrease in the number of medium-level counties, and a corresponding (−5.84 percentage points) decrease in the number of low-level counties. Five (9.62%) of 52 jurisdictions had no high- or medium-level counties this week.
To check your COVID-19 Community Level, visit COVID Data Tracker.
U.S. COVID-19 Community Levels by County
resize iconView Larger

COVID-19 Community Levels
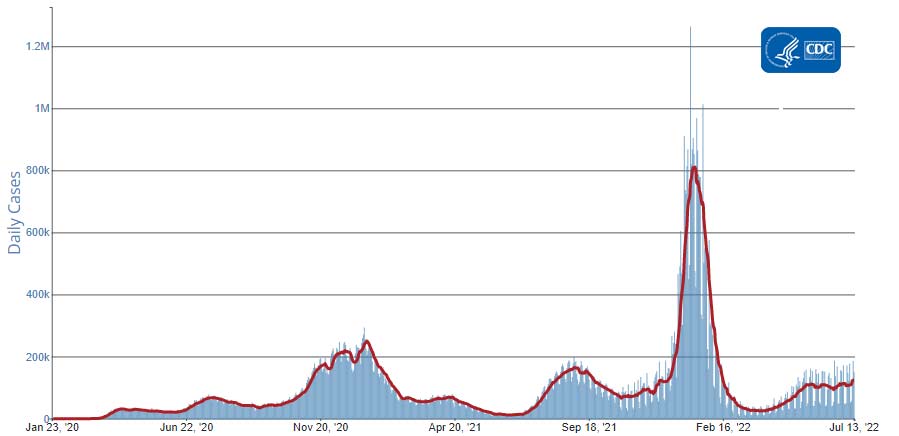
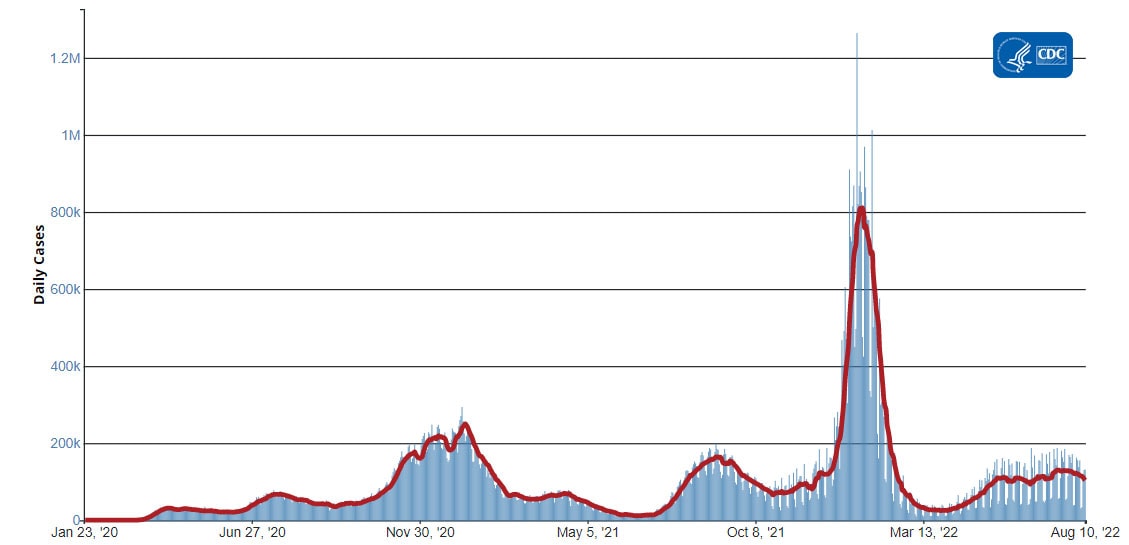
Reported Cases
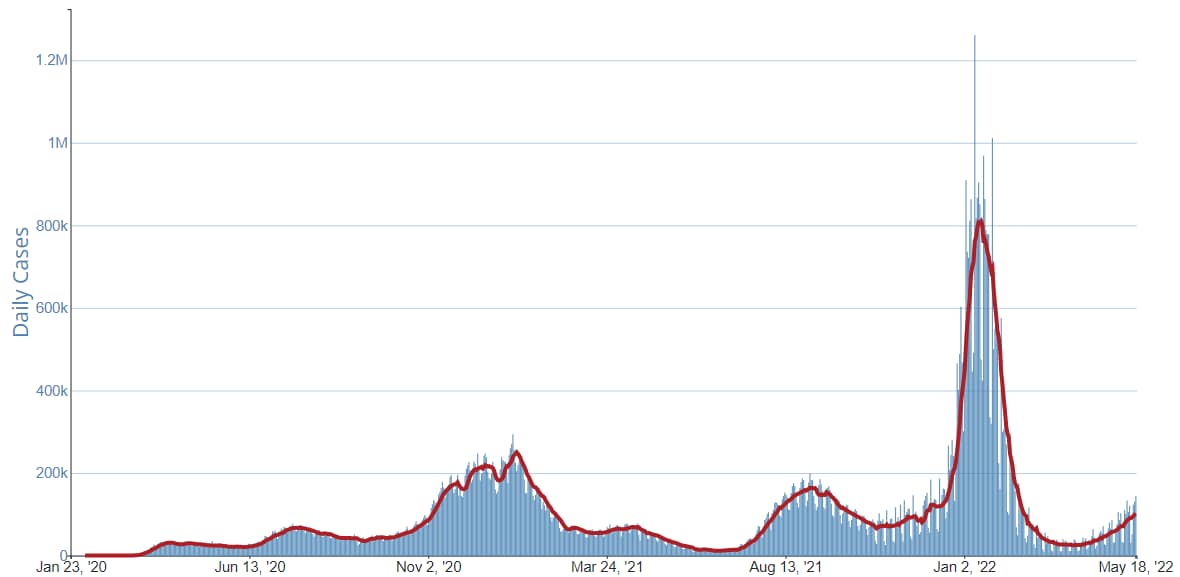
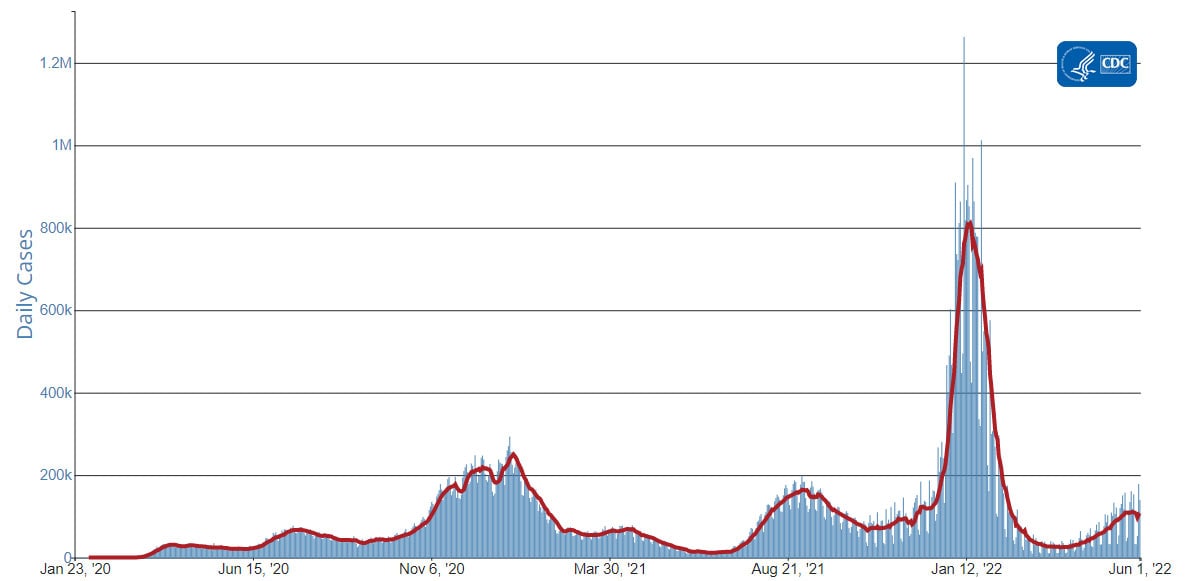
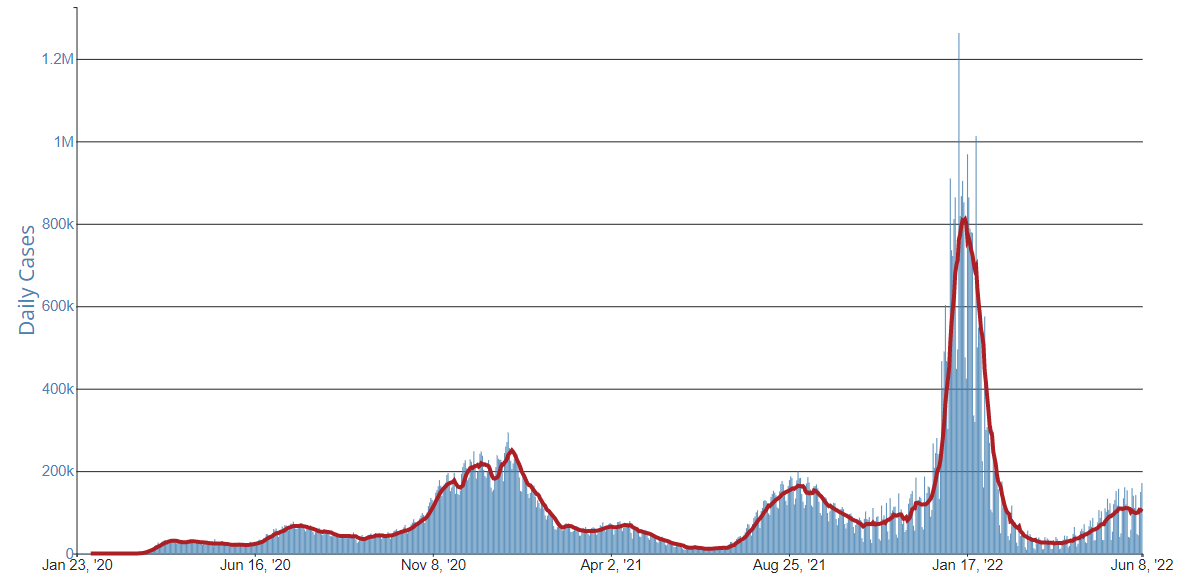
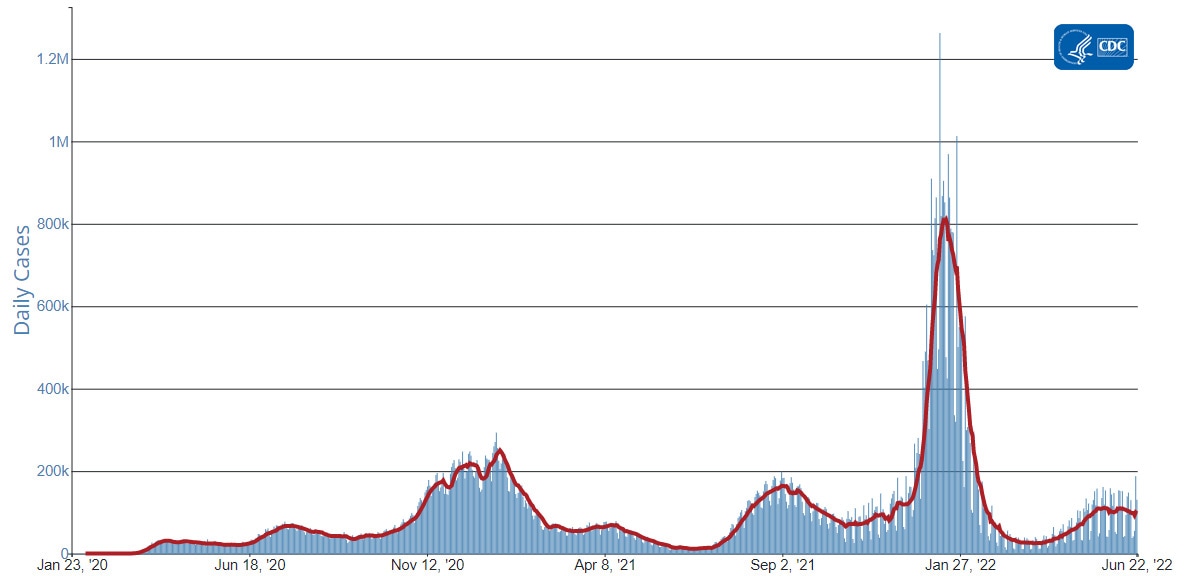
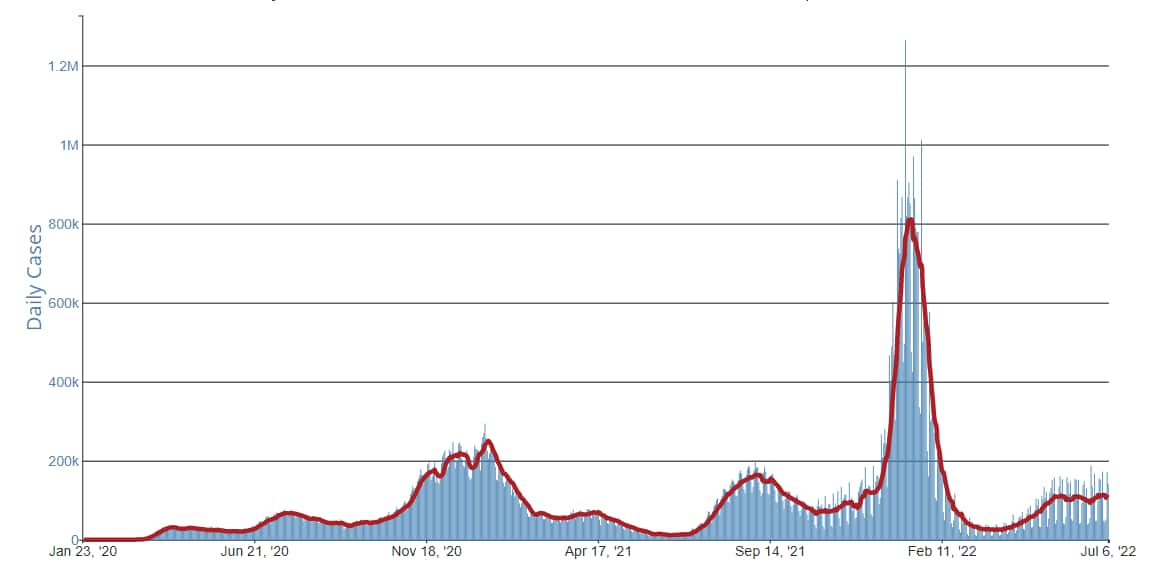
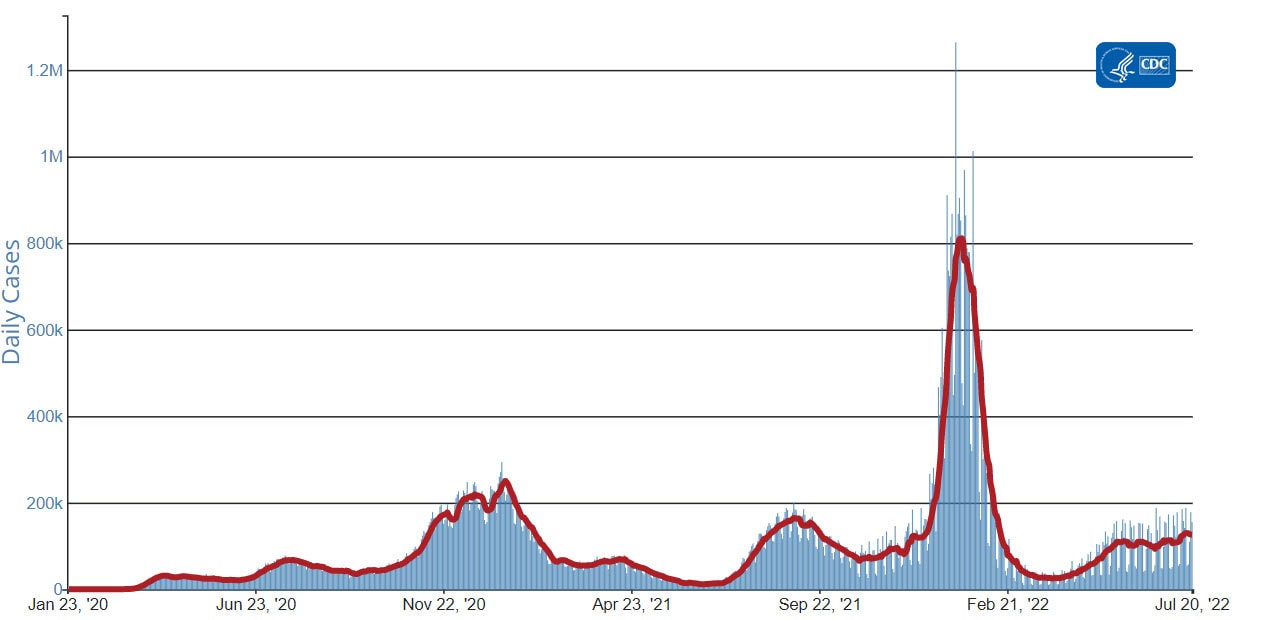
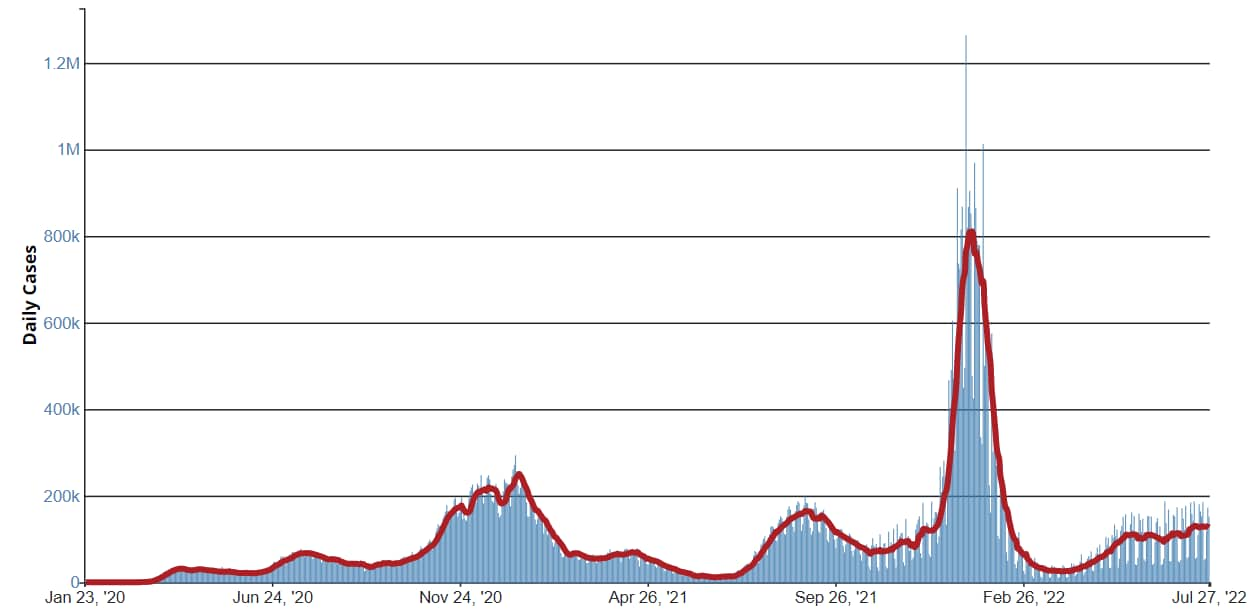
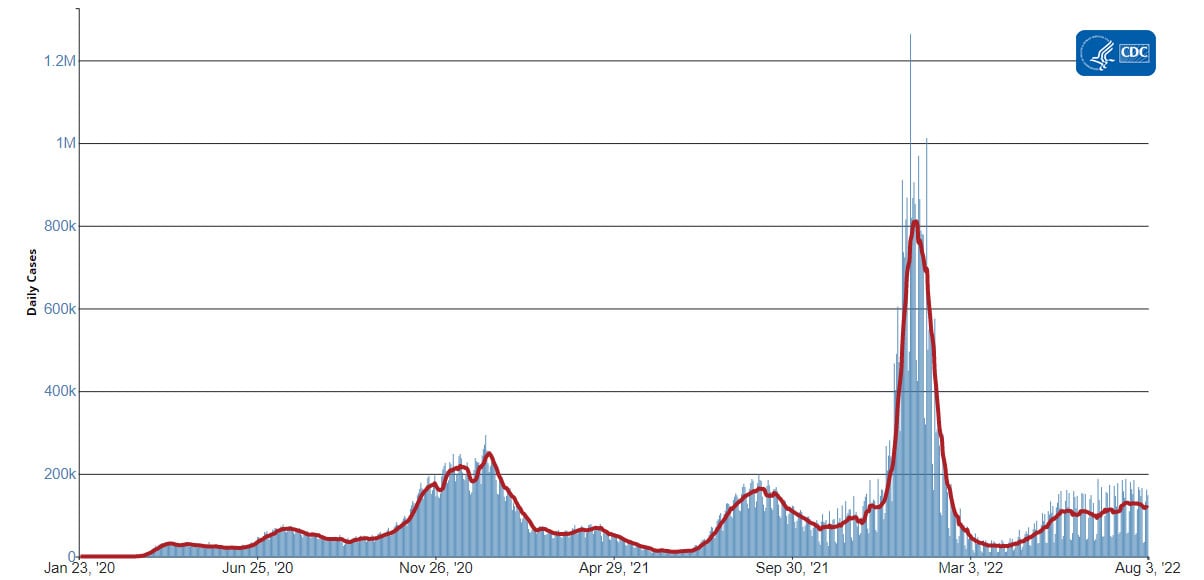
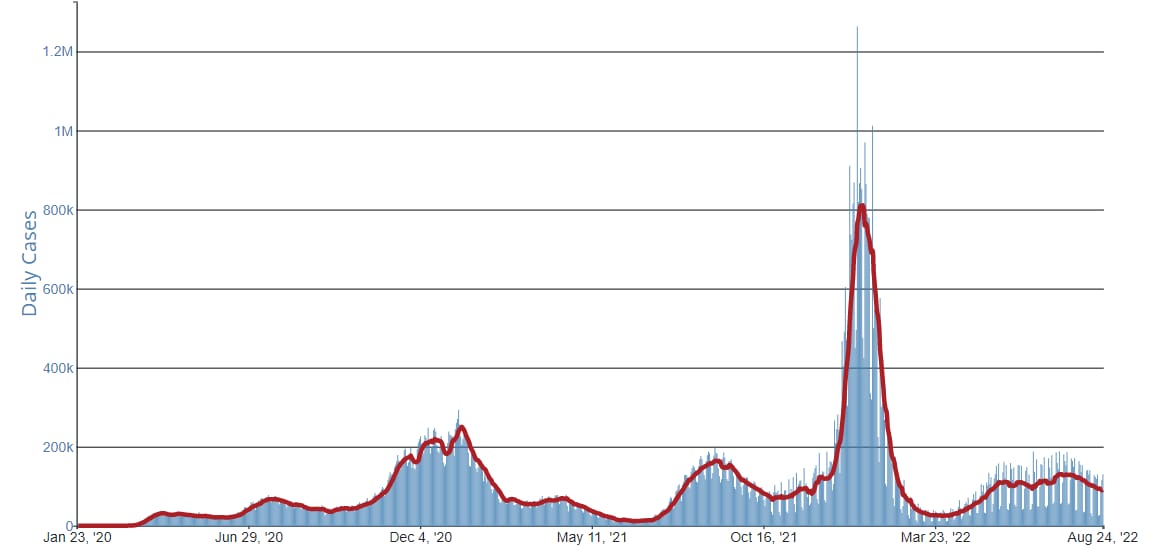
As of May 18, 2022, the current 7-day moving average of daily new cases (101,130) increased by 18.8% compared with the previous 7-day moving average (85,143). A total of 82,820,565 COVID-19 cases have been reported in the United States as of May 18, 2022.
CDC Nowcast projections* for the week ending May 14, 2022, estimate the combined national proportion of lineages designated as Omicron to be 100%. There are several lineages of Omicron (B.1.1.529, BA.1, BA.2, BA.3, BA.4, and BA.5), and within each are multiple sublineages. COVID Data Tracker shows the proportions of Omicron lineages grouped as follows: the B.1.1.529 lineage (includes BA.1, BA.3, BA.4 and BA.5), the BA.1.1** lineage, the BA.2 lineage, and the BA.2.12.1 lineage. The predominant Omicron lineage in the United States is BA.2. The national proportion of BA.2 is projected to be 50.9% (95% PI 44.9-56.9%). The national proportion of BA.2.12.1 is projected to be 47.5% (95% PI 41.5-53.5%). B.1.1.529 (BA.1, BA.3, BA.4 and BA.5) is projected to be 1.2% (95% PI 0.6-2.2%), and BA.1.1 is projected to be 0.3% (95% PI 0.2-0.4%). Omicron is predicted to be 100% in all HHS regions.
82,820,565
Total Cases Reported
101,130
Current 7-Day Average***
85,143
Prior 7-Day Average
18.8%
Change in 7-Day Average since Prior Week
**The median time from specimen collection to sequence data reporting is about 3 weeks. As a result, weighted estimates for the most recent few weeks may be unstable or unavailable. CDC’s Nowcast is a data projection tool that helps fill this gap by generating timely estimates of variant proportions for variants that are circulating in the United States. View Nowcast estimates on CDC’s COVID Data Tracker website on the Variant Proportions page.
**For national data, the proportion of BA.1.1 is shown separately. For regional data, the proportion of BA.1.1 is also aggregated with B.1.1.529.
***Historical cases are excluded from daily new cases and 7-day average calculations until they are incorporated into the dataset for the applicable date. Of 533,665 historical cases reported retroactively, 10,795 were reported in the current week and 5 were reported in the prior week.
Daily Trends in COVID-19 Cases in the United States Reported to CDC

7-Day moving average
resize iconView Larger
More Case Data
Vaccinations
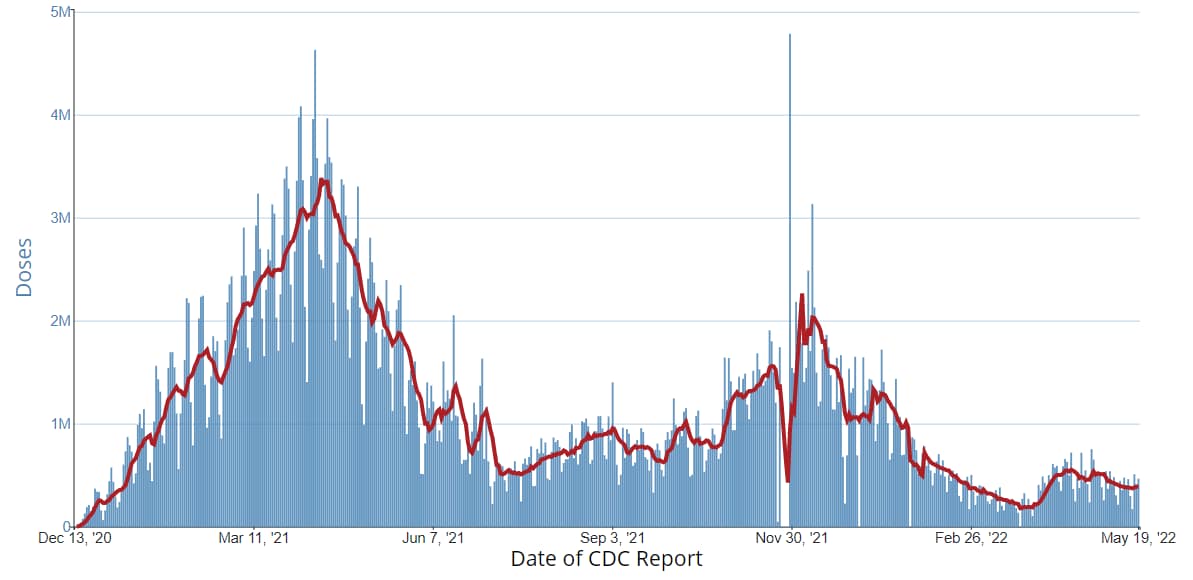
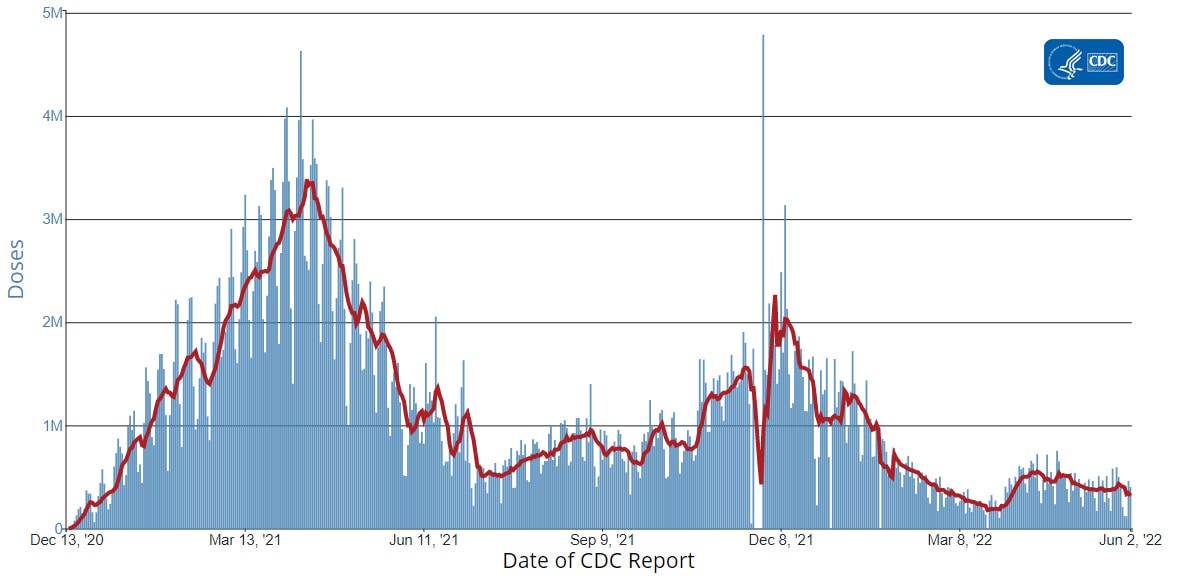
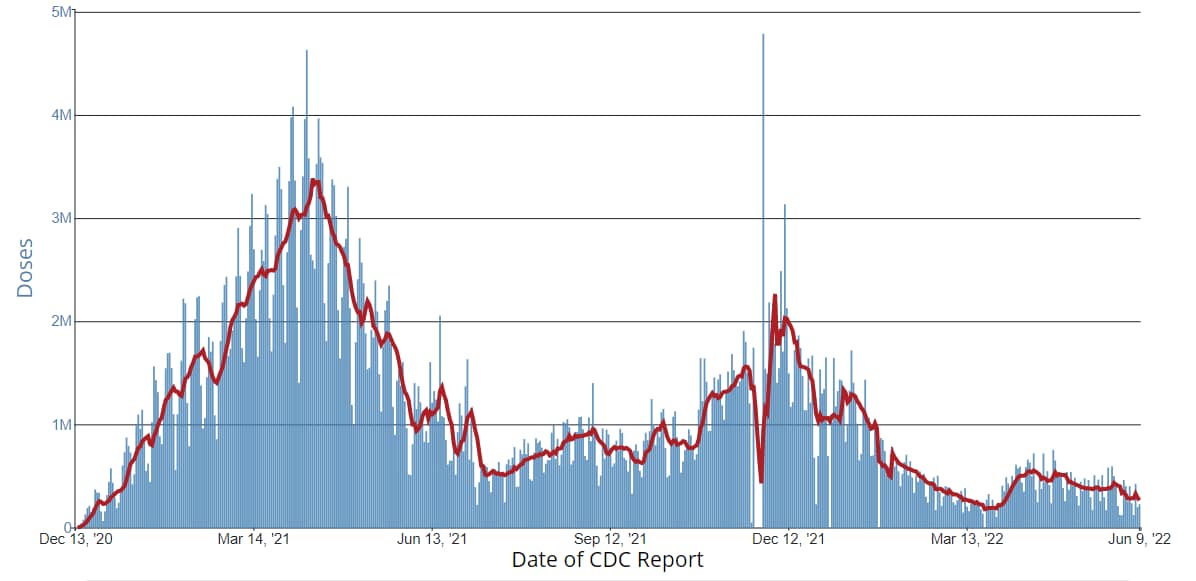
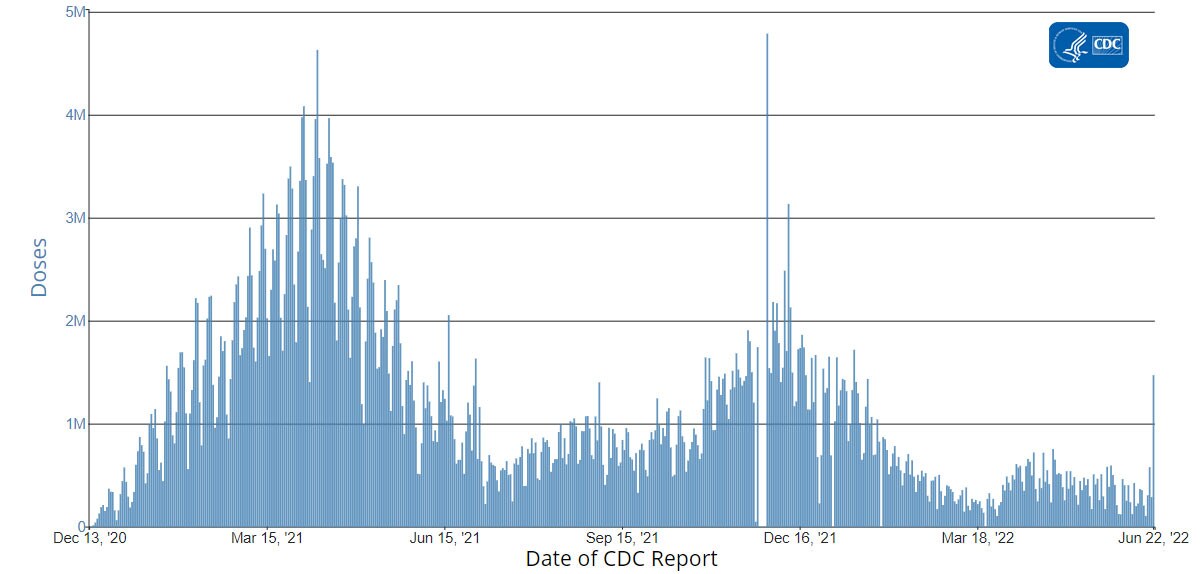
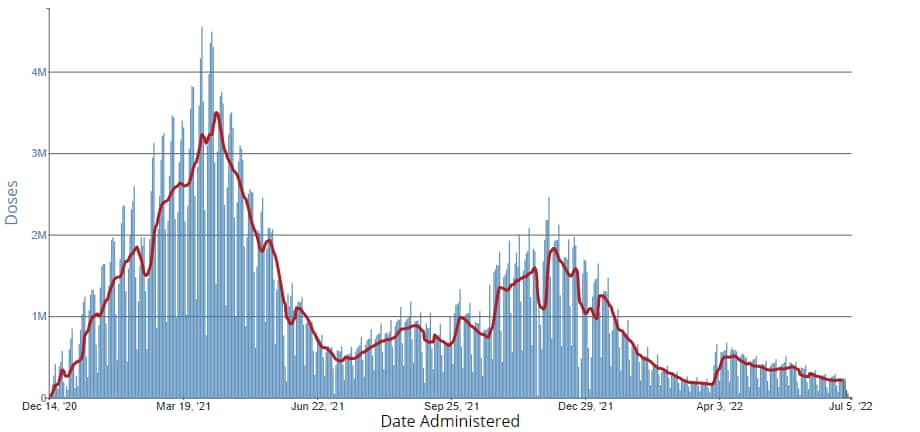
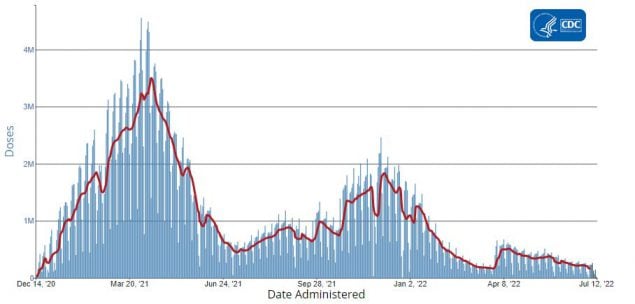
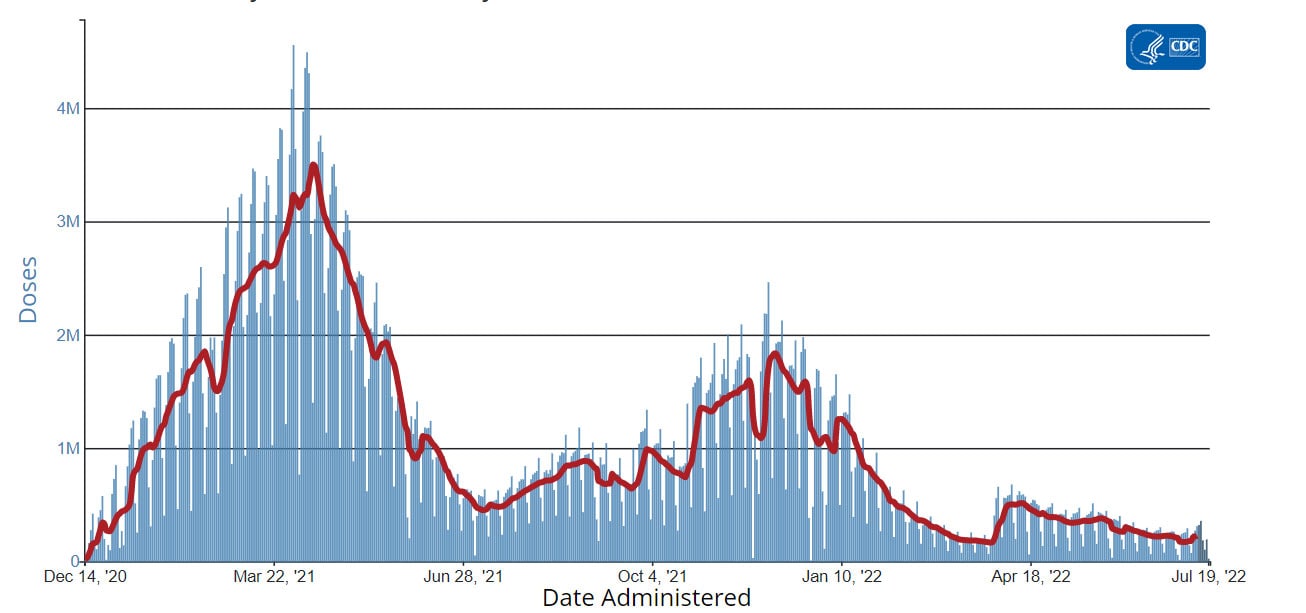
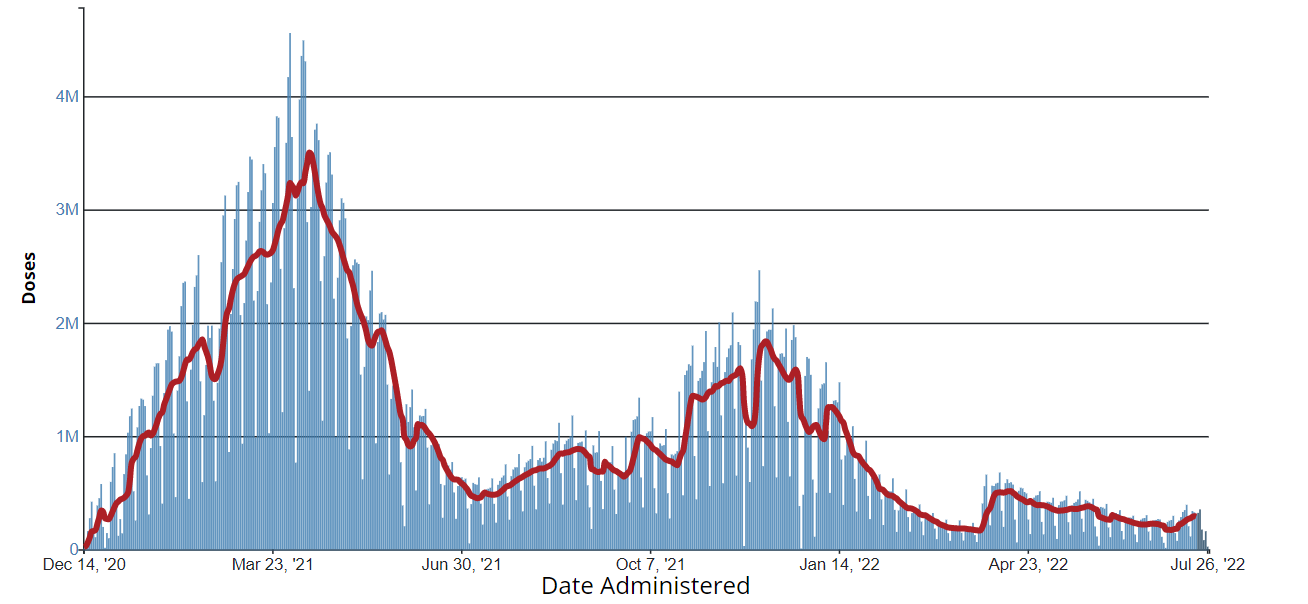
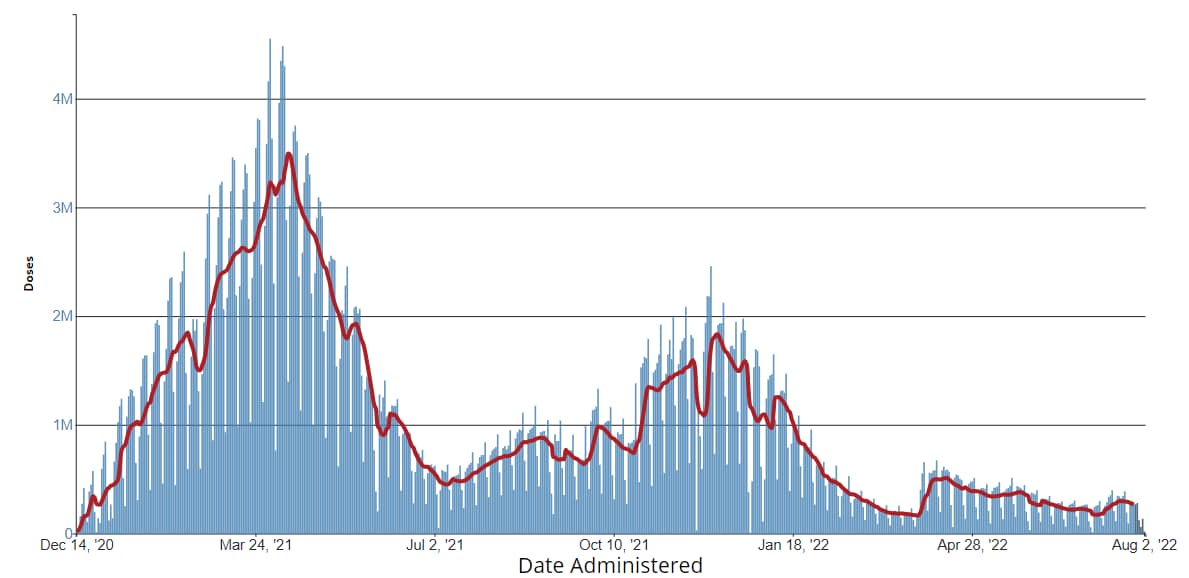
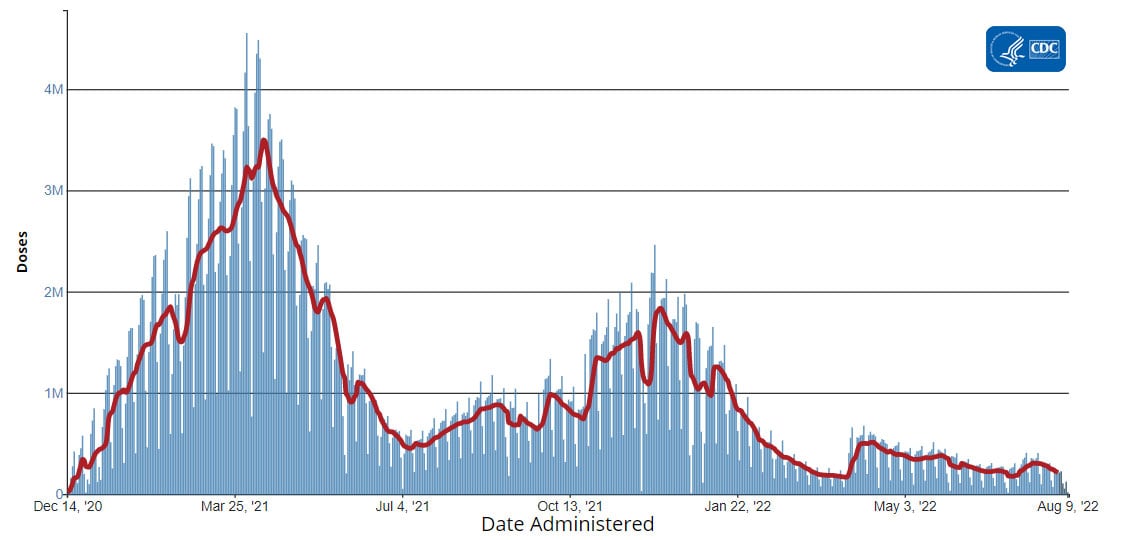
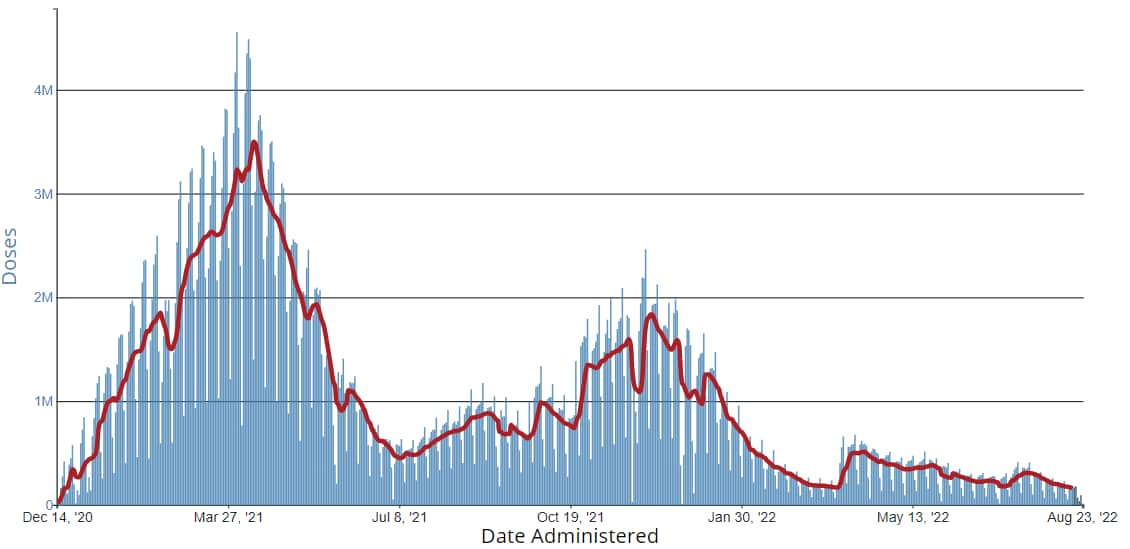
The U.S. COVID-19 Vaccination Program began December 14, 2020. As of May 18, 2022, 582.8 million vaccine doses have been administered in the United States. Overall, about 258.0 million people, or 77.7% of the total U.S. population, have received at least one dose of vaccine. About 220.7 million people, or 66.5% of the total U.S. population, have been fully vaccinated.* Of those fully vaccinated, about 102.4 million people have received a booster dose,** but 49.1% of the total booster-eligible population has not yet received a booster dose. As of May 18, 2022, the 7-day average number of administered vaccine doses reported (by date of CDC report) to CDC per day was 388,308, a 0.5% decrease from the previous week.
CDC’s COVID Data Tracker displays vaccination trends by age group, race/ethnicity, and urban/rural status. To see trends by age group and race/ethnicity, visit the Vaccination Demographic Trends tab. To see trends by urban/rural status, visit the COVID-19 Vaccination Equity tab.
582,757,136
Vaccine Doses Administered
258,008,907
People who received at least one dose
220,739,345
People who are fully vaccinated*
77.7%
Percentage of the U.S. population that has received at least one dose
66.5%
Percentage of the U.S. population that has been fully vaccinated*
-0.1
Percentage point increase from last week
+0.2
Percentage point increase from last week
*Represents the number of people who have received the second dose in a two-dose COVID-19 vaccine series (such as the Pfizer-BioNTech or Moderna vaccines) or one dose of the single-shot Johnson & Johnson’s Janssen vaccine.
**Represents the number of people who are fully vaccinated and have received another dose of COVID-19 vaccine since August 13, 2021. This includes people who received their first additional dose or booster.
Daily Change in the Total Number of Administered COVID-19 Vaccine Doses Reported to CDC by the Date of CDC Report, United States
7-Day moving average
resize iconView Larger
More Vaccination Data
Hospitalizations
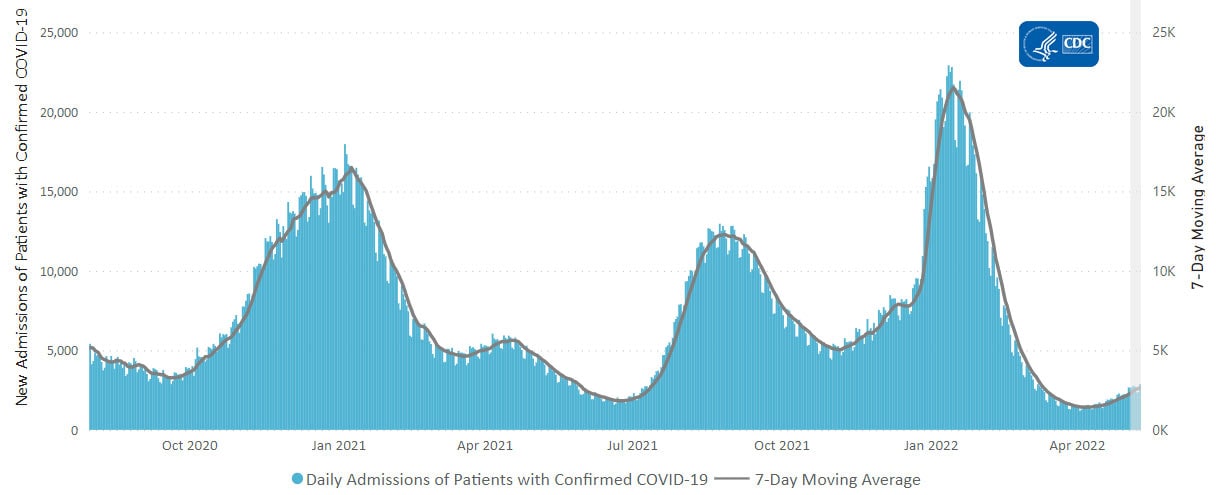
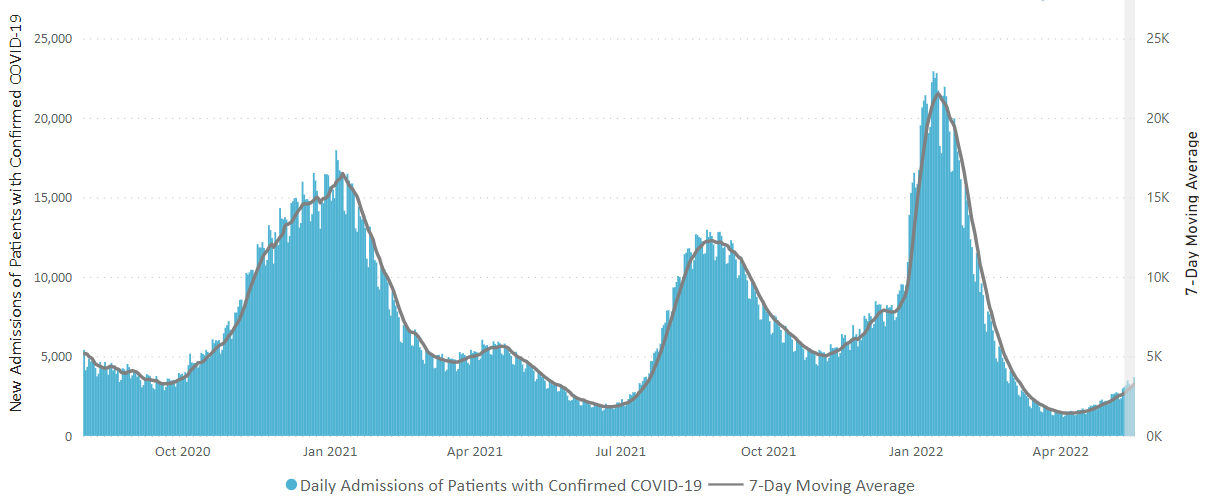
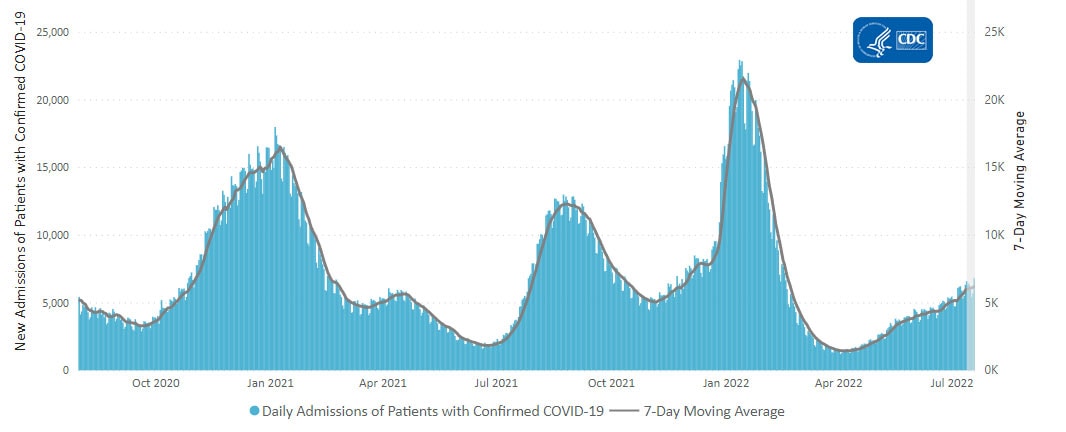
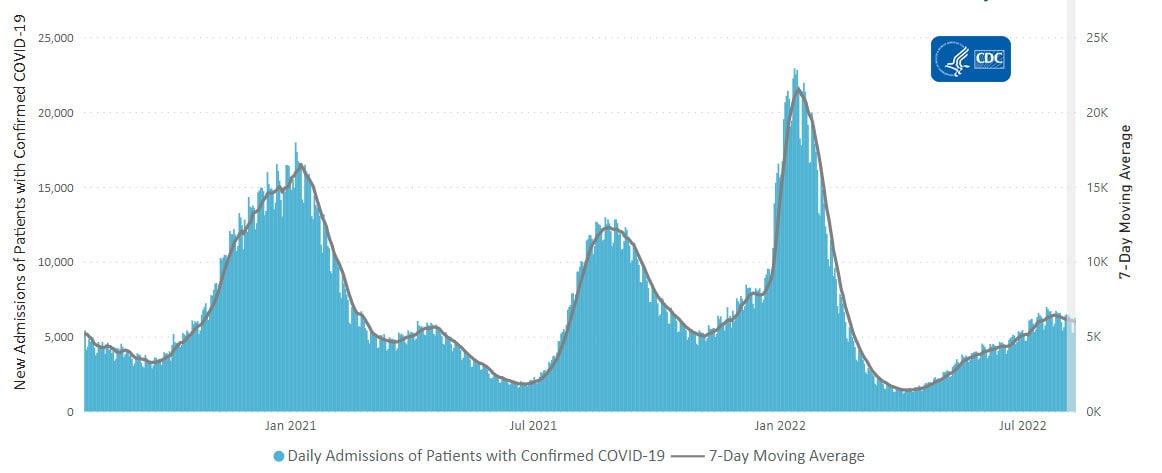
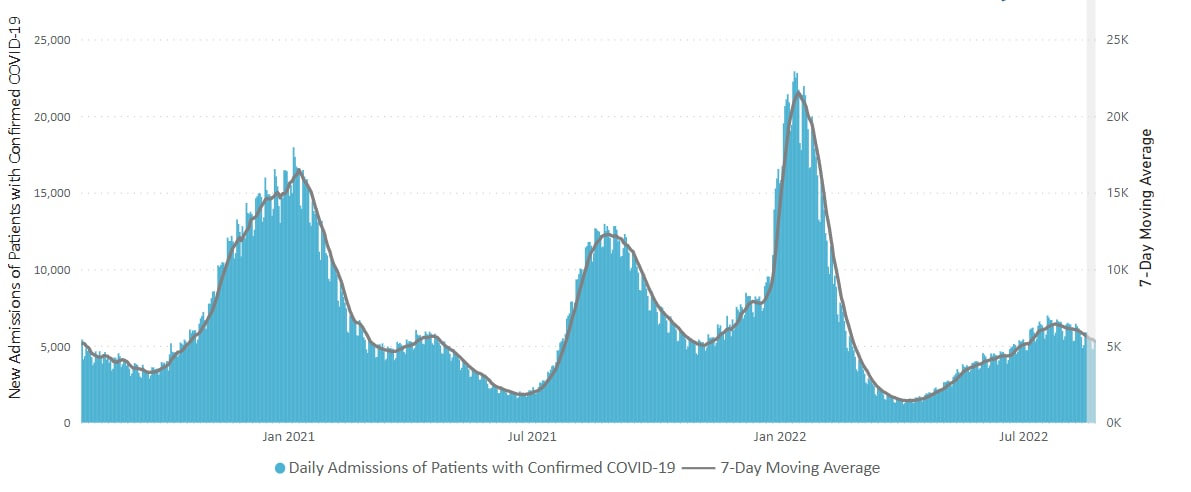
New Hospital Admissions
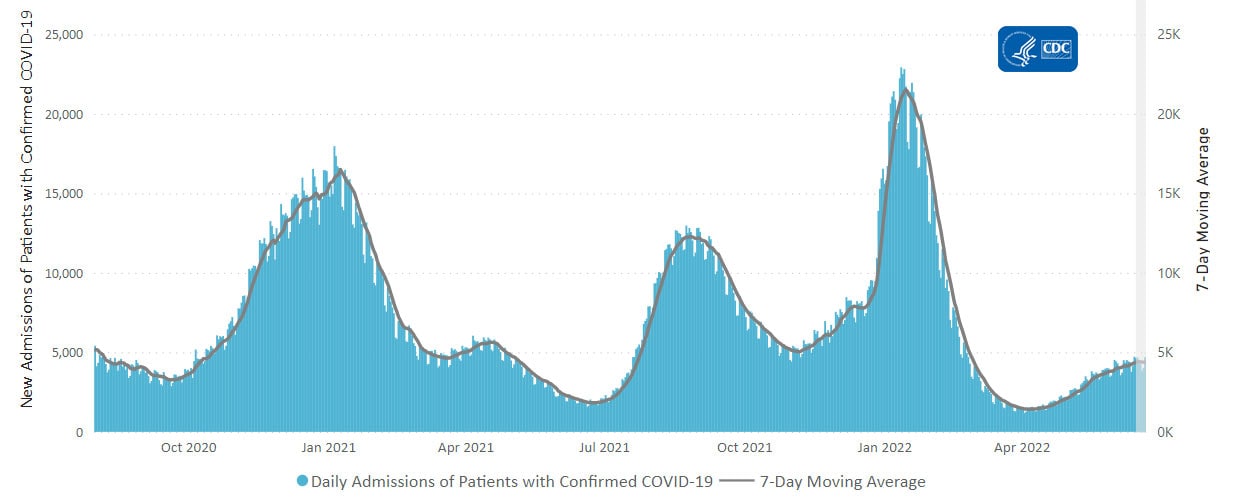
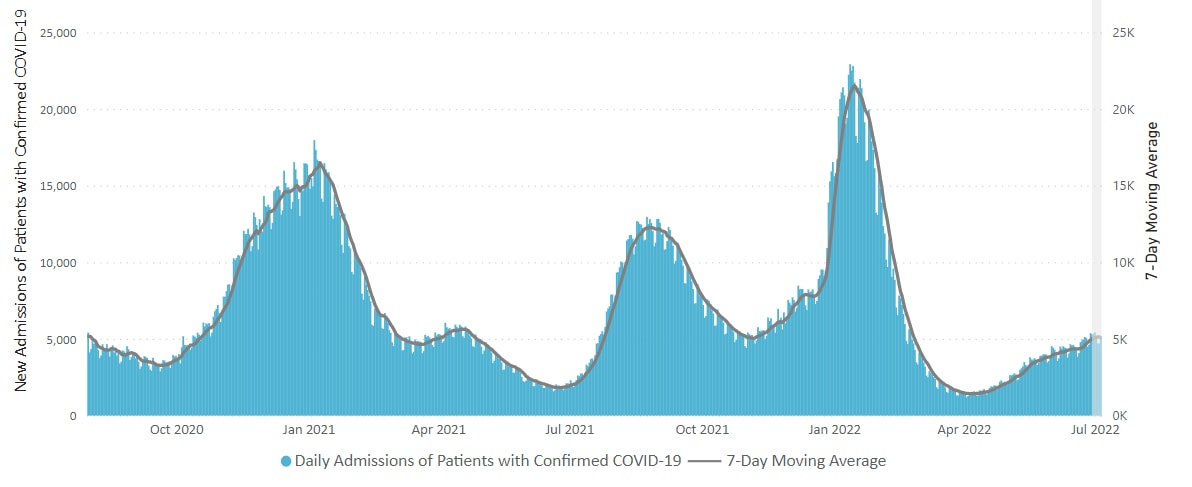
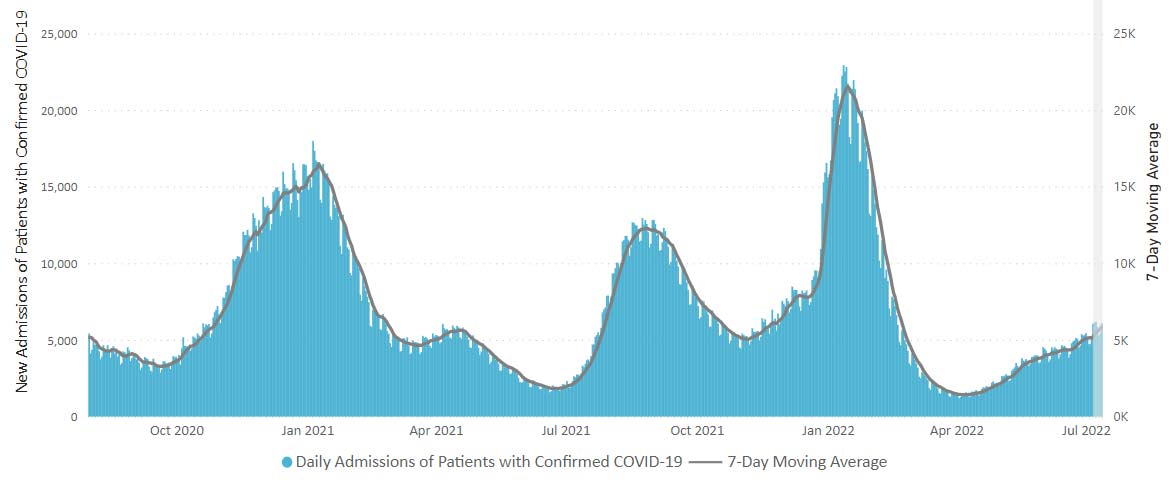
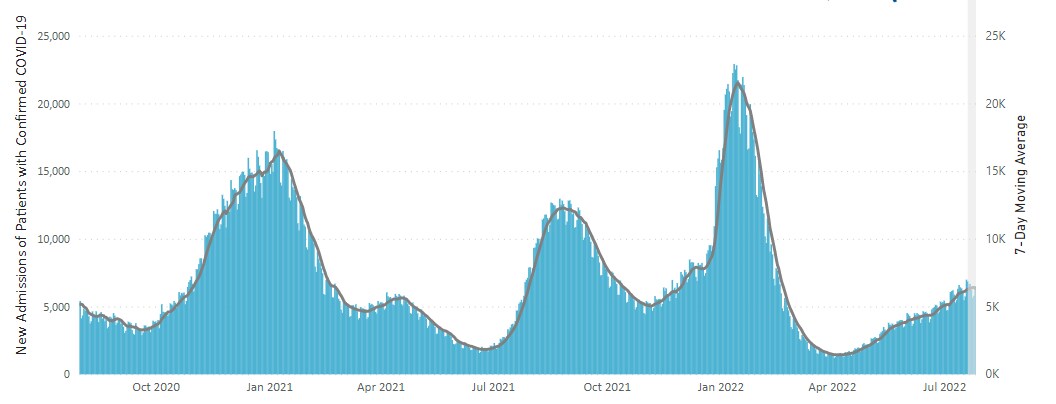
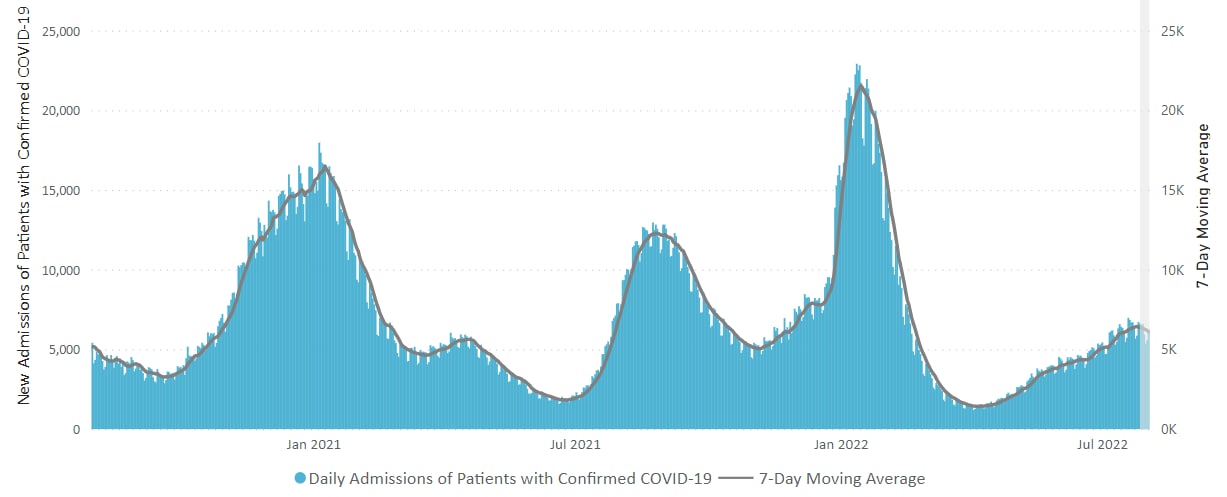
The current 7-day daily average for May 11–17, 2022, was 3,250. This is a 24.2% increase from the prior 7-day average (2,617) from May 4–10, 2022.
4,693,725
Total New Admissions
3,250
Current 7-Day Average
2,617
Prior 7-Day Average
+24.2%
Change in 7-Day Average
The start of consistent reporting of hospital admissions data was August 1, 2020.
Daily Trends in Number of New COVID-19 Hospital Admissions in the United States
resize iconView Larger
New admissions are pulled from a 10 am EDT snapshot of the HHS Unified Hospital Data – Analytic Dataset. Due to potential reporting delays, data from the most recent 7 days, as noted in the figure above with the grey bar, should be interpreted with caution. Small shifts in historic data may also occur due to changes in the Centers for Medicare & Medicaid Services (CMS) Provider of Services file, which is used to identify the cohort of included hospitals.
More Hospital Data
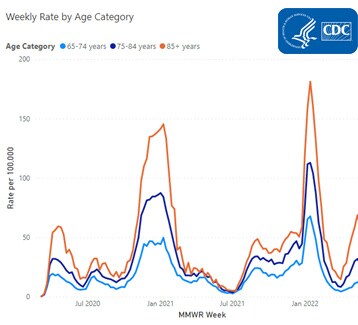
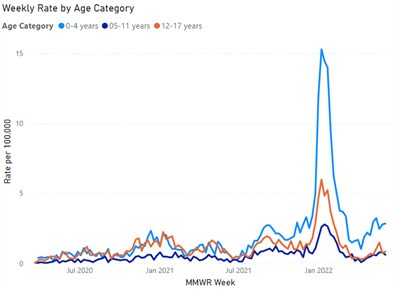
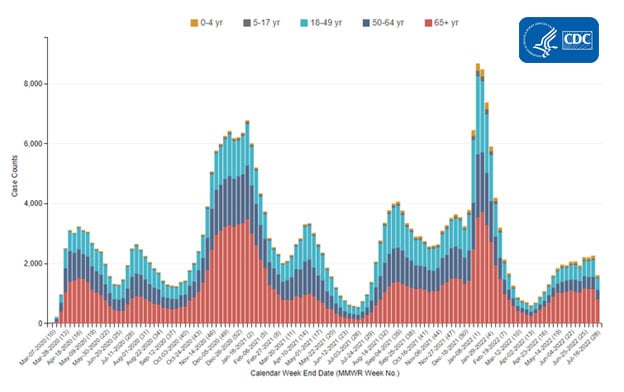
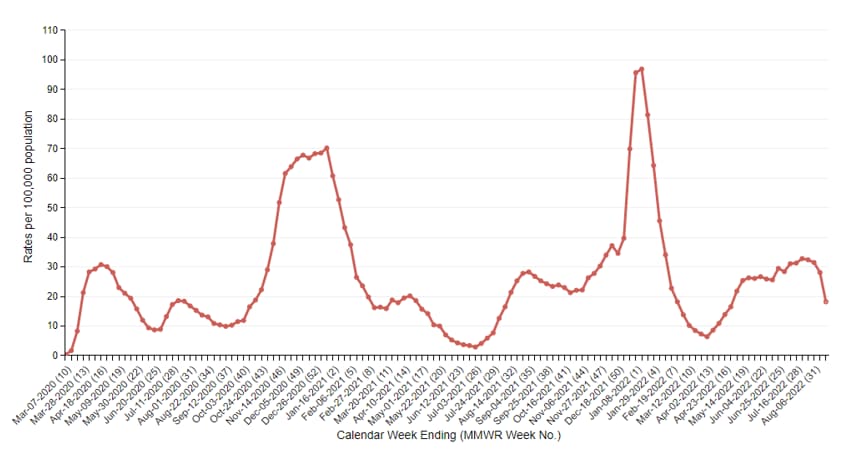
COVID-NET: Hospitalization Rates among Certain Racial and Ethnic Groups
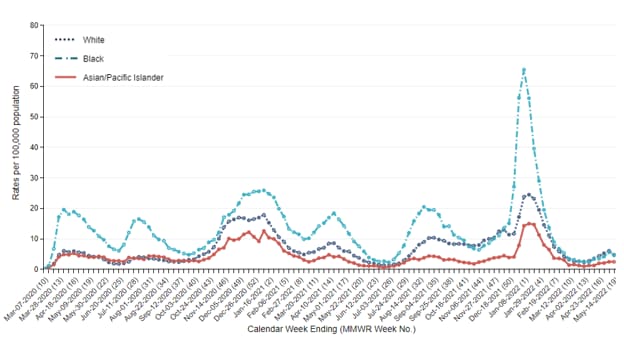
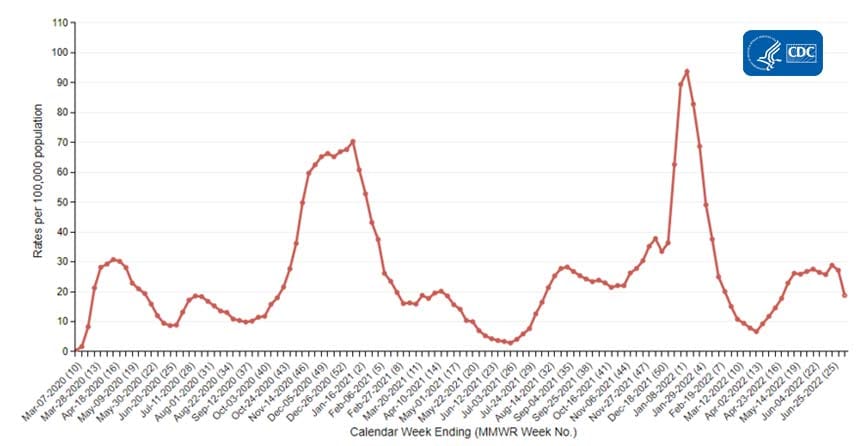
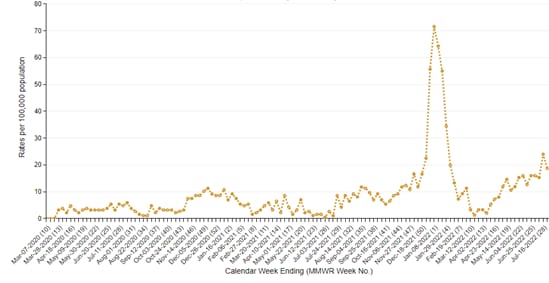
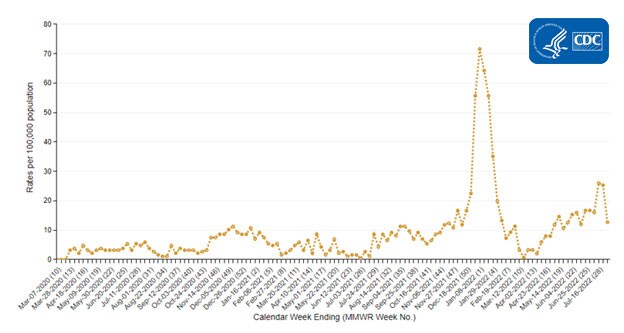
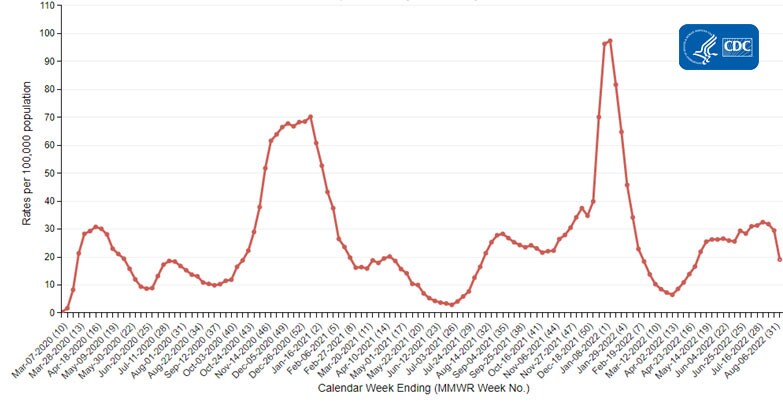
CDC’s Coronavirus Disease 2019-Associated Hospitalization Surveillance Network (COVID-NET) shows that overall rates of COVID-19-associated hospitalizations have increased more sharply within certain racial and ethnic groups. The largest increase was seen among non-Hispanic White persons when rates increased from 2.3 per 100,000 population for week ending April 2 to 5.3 per 100,000 population for the week ending May 7, 2022. Rates among non-Hispanic Black persons also increased, from 2.3 per 100,000 population on April 2 to 4.2 per 100,000 population on May 7. Additionally, rates among non-Hispanic Asian and Pacific Islander persons have increased from 1.0 per 100,000 population on April 2 to 2.1 per 100,000 population on May 7.
Rates of COVID-19-Associated Hospitalizations among non-Hispanic White, Black, and Asian/Pacific Islander Persons
resize iconView Larger
The Coronavirus Disease 2019 (COVID-19)-Associated Hospitalization Surveillance Network (COVID-NET) is an additional source for hospitalization data collected through a network of more than 250 acute-care hospitals in 14 states (representing ~10% of the U.S. population). Detailed data on patient demographics, including race/ethnicity, underlying medical conditions, medical interventions, and clinical outcomes, are collected using a standardized case reporting form.
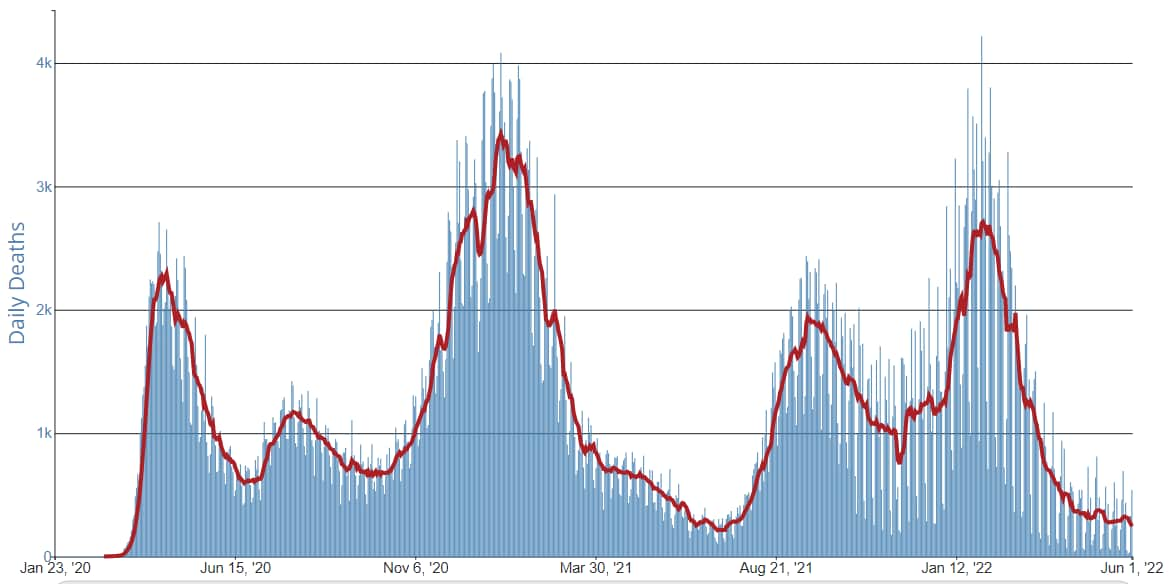
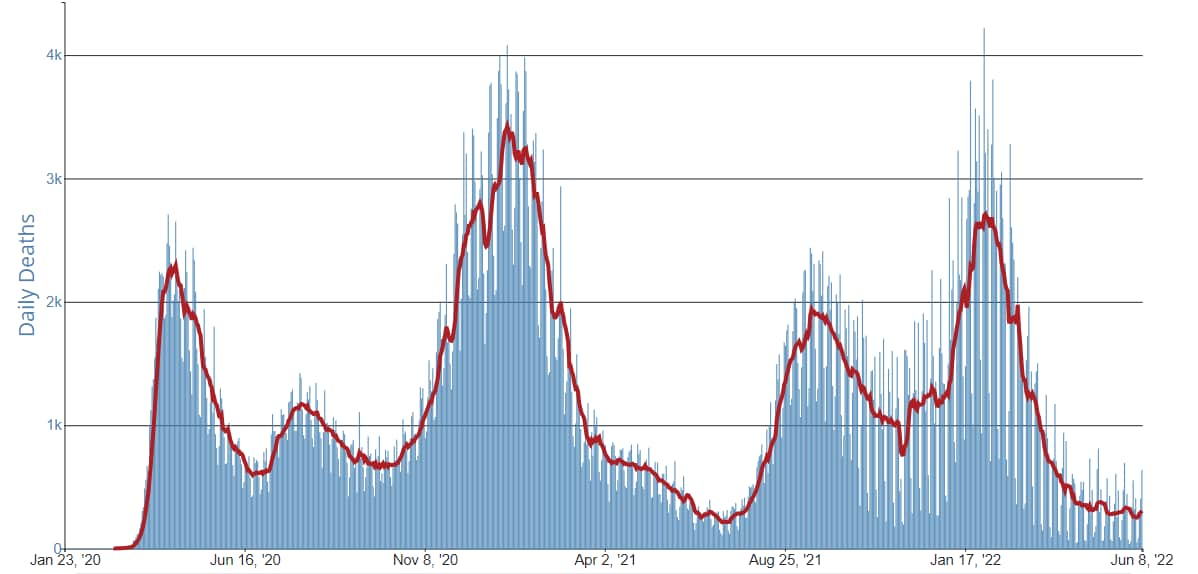
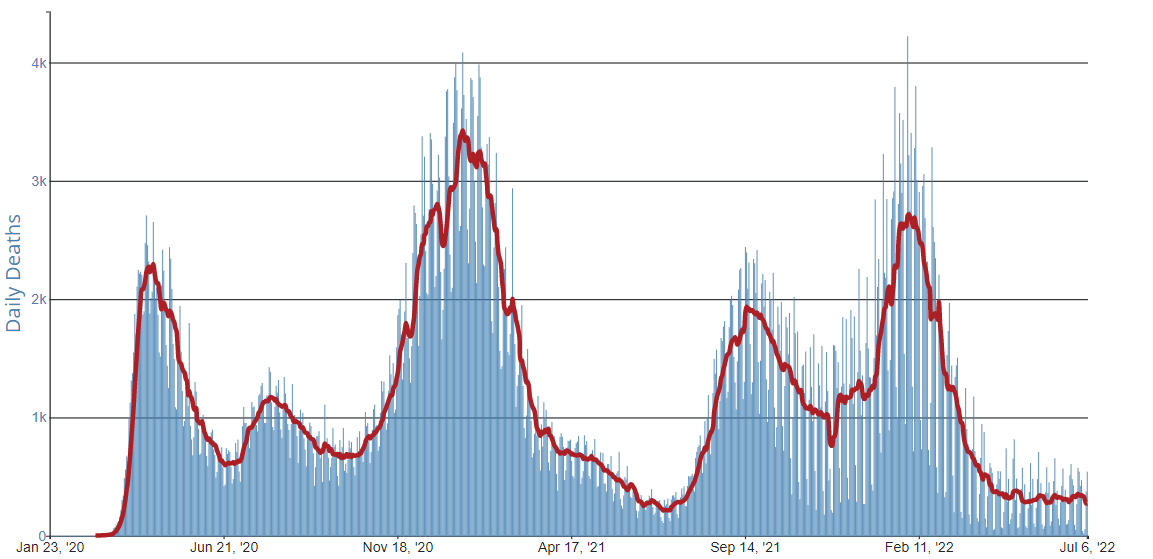
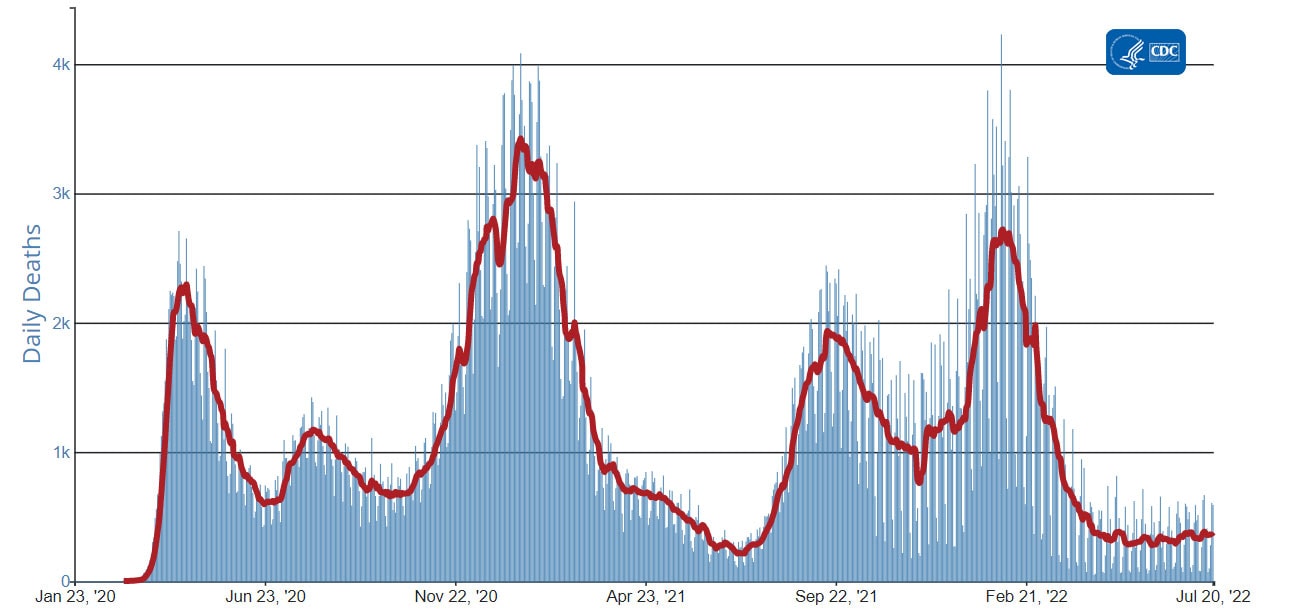
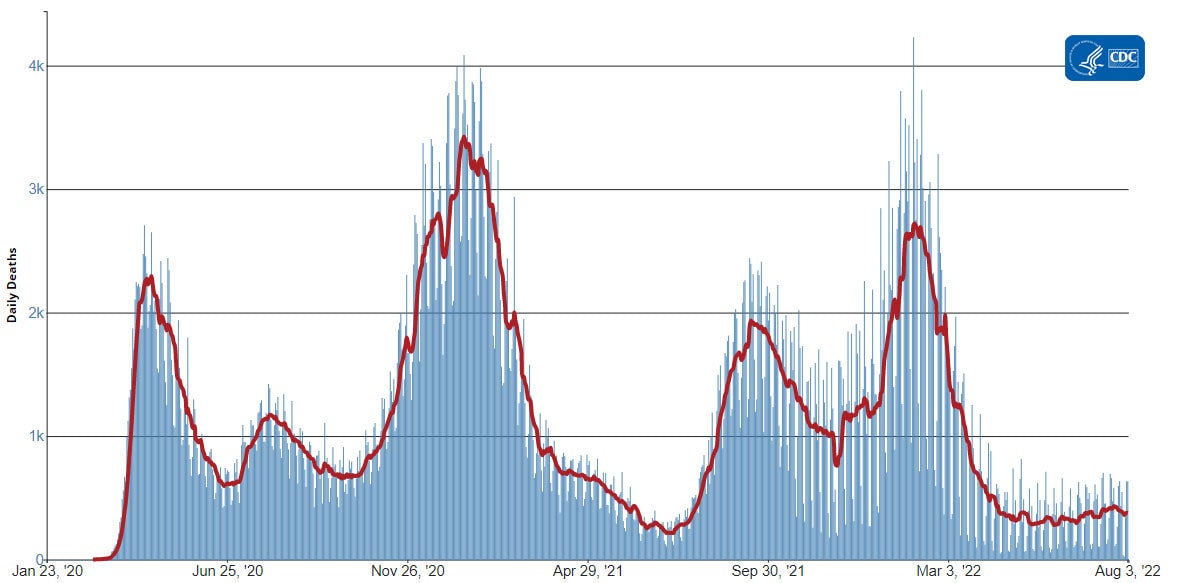
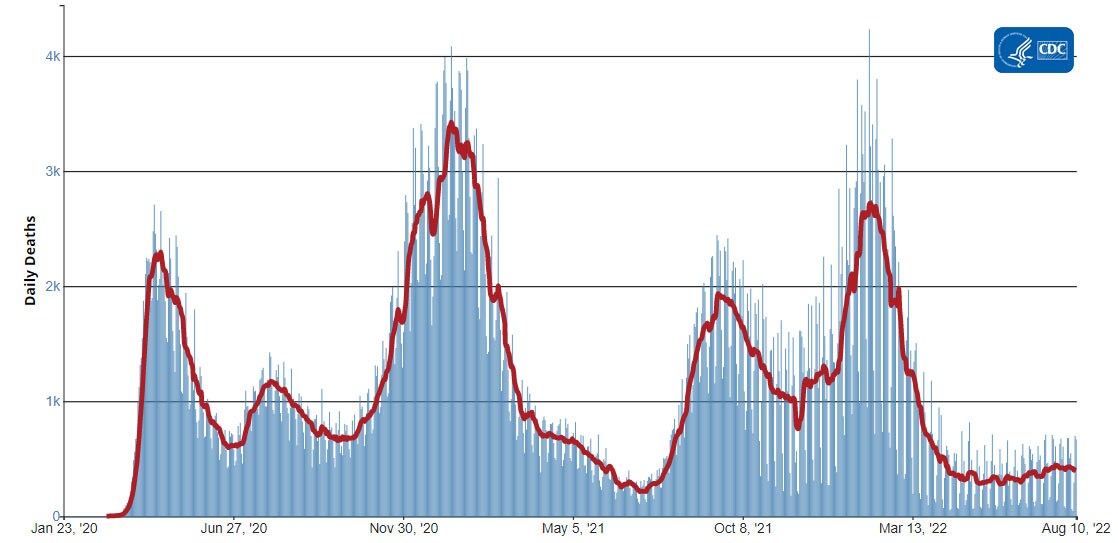
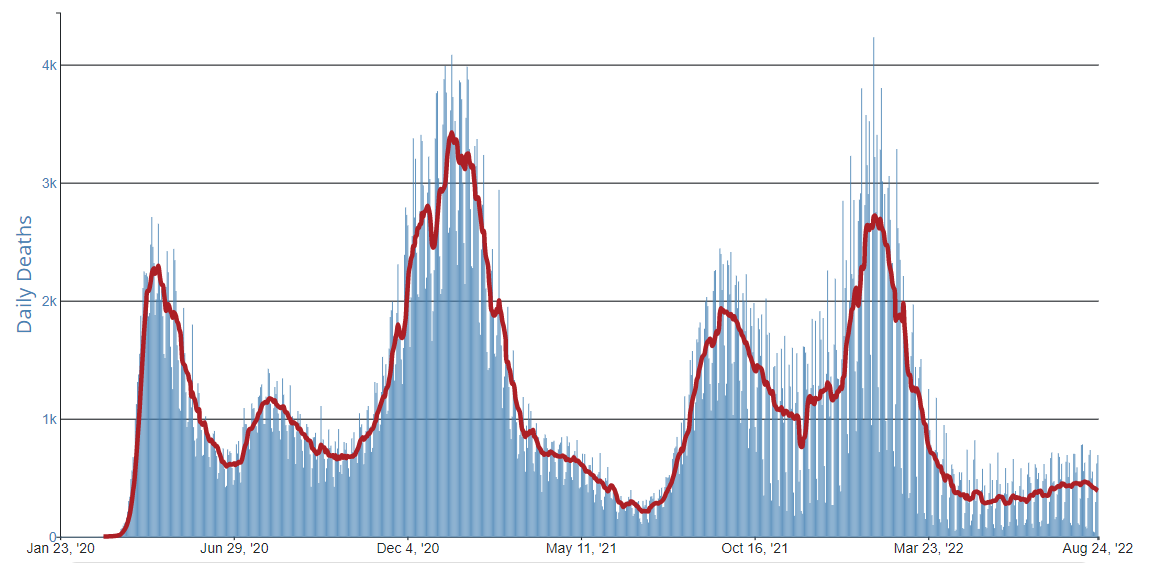
Deaths
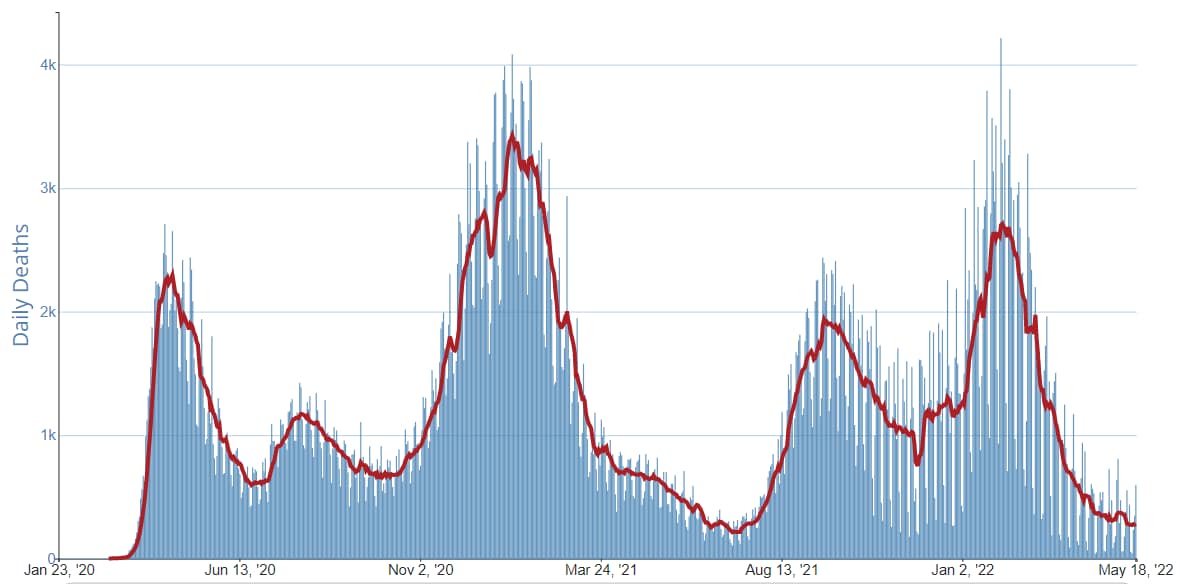
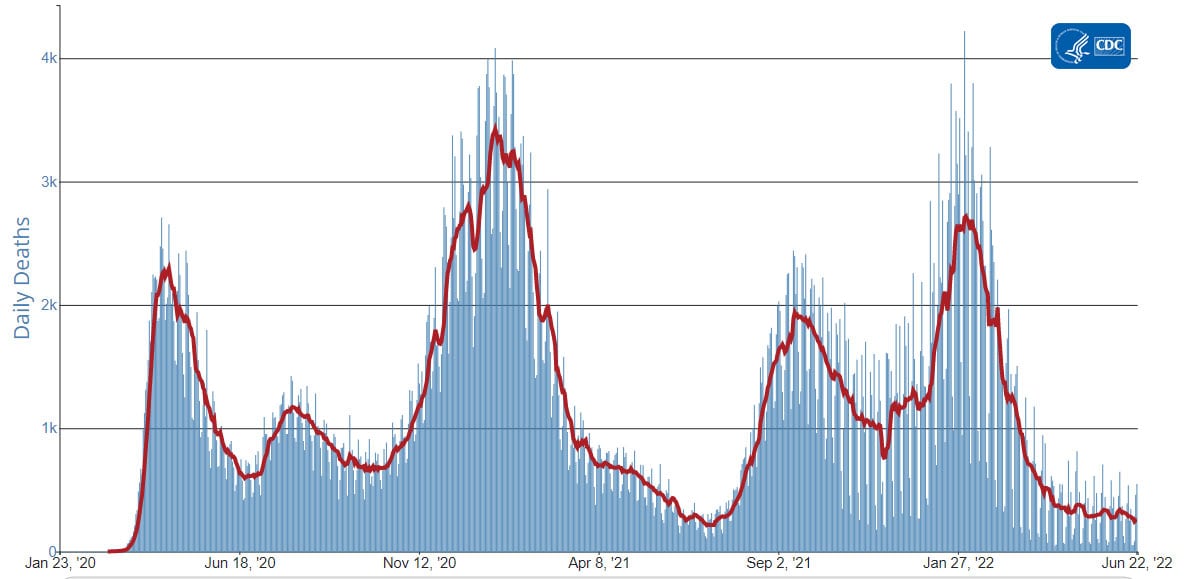
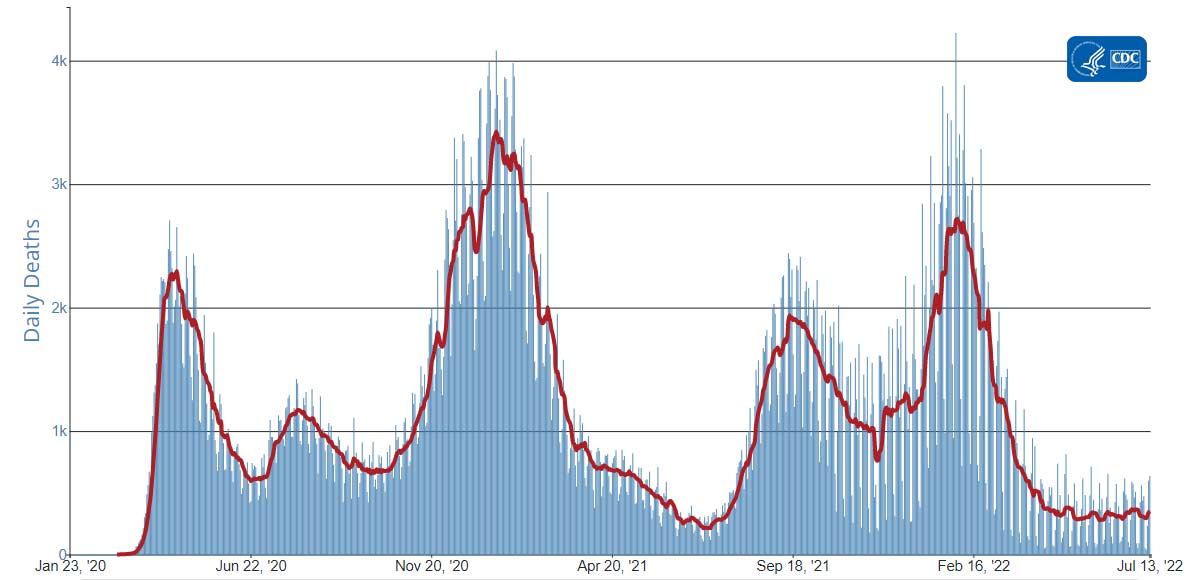
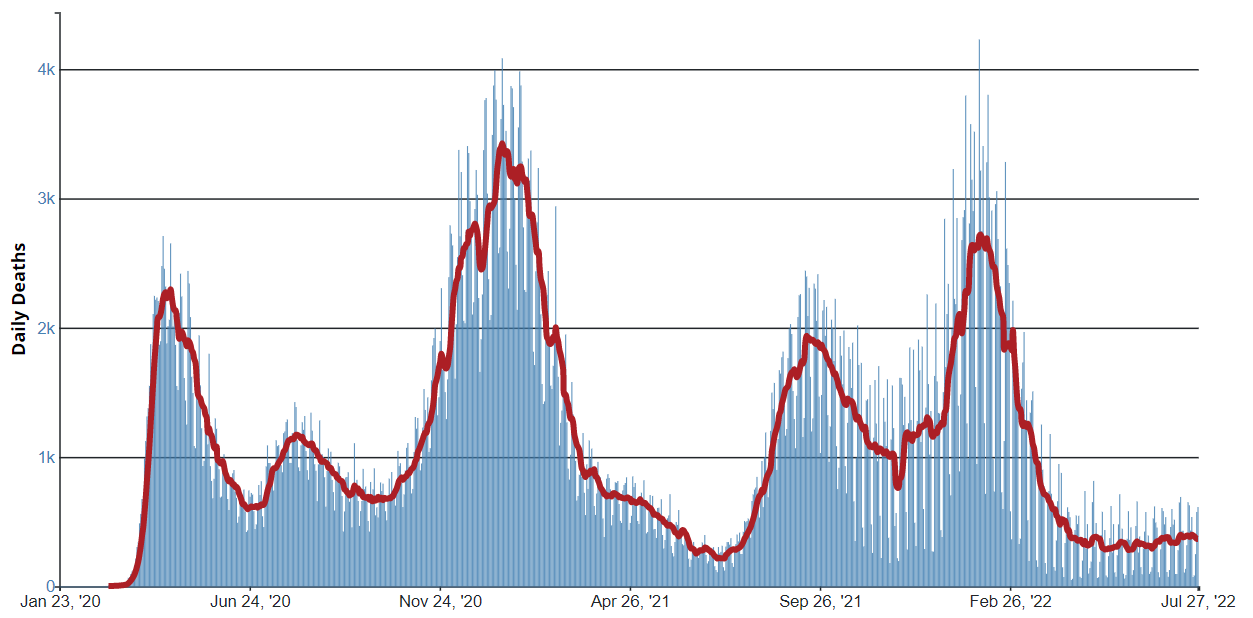
The current 7-day moving average of new deaths (280) has decreased 1.2% compared with the previous 7-day moving average (284). As of May 18, 2022, a total of 998,512 COVID-19 deaths have been reported in the United States.
998,512
Total Deaths Reported
280
Current 7-Day Average*
284
Prior 7-Day Average
-1.2%
Change in 7-Day Average Since Prior Week
*Historical deaths are excluded from the daily new deaths and 7-day average calculations until they are incorporated into the dataset by their applicable date. Of 21,418 historical deaths reported retroactively, 0 were reported in the current week; and 0 were reported in the prior week.
Daily Trends in Number of COVID-19 Deaths in the United States Reported to CDC
7-Day moving average
resize iconView Larger
More Death Data
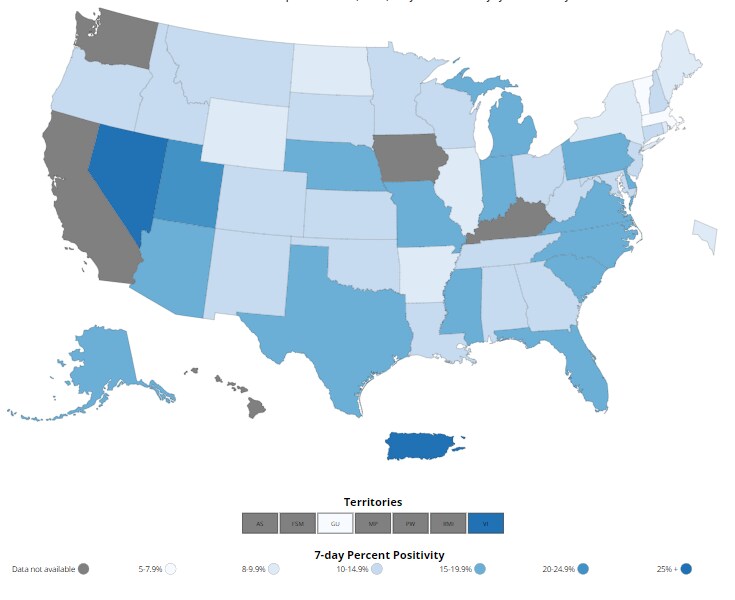
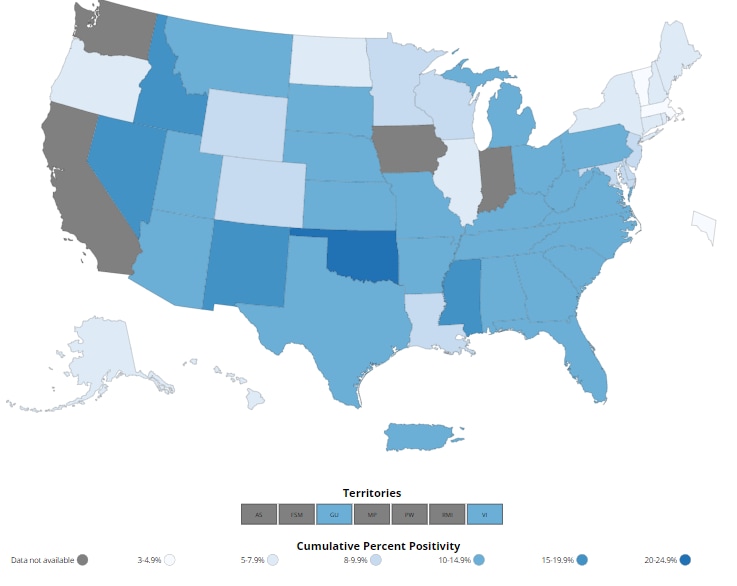
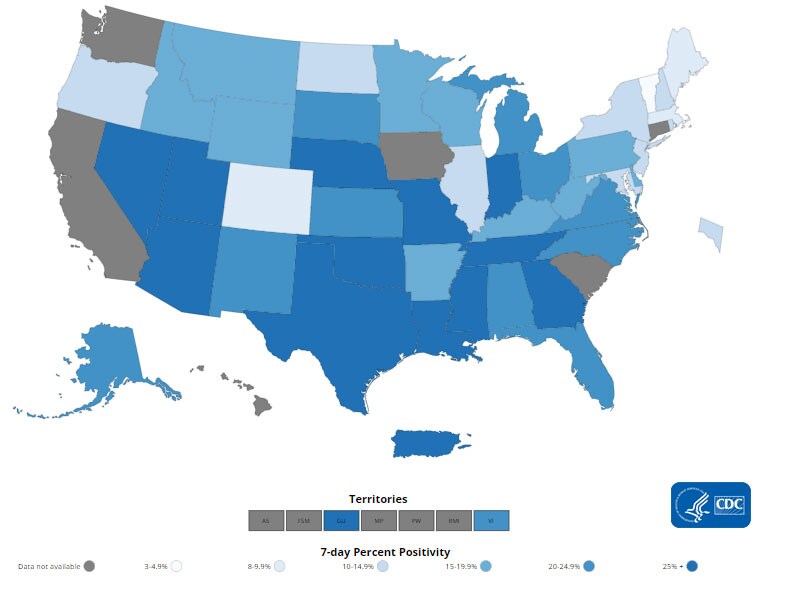
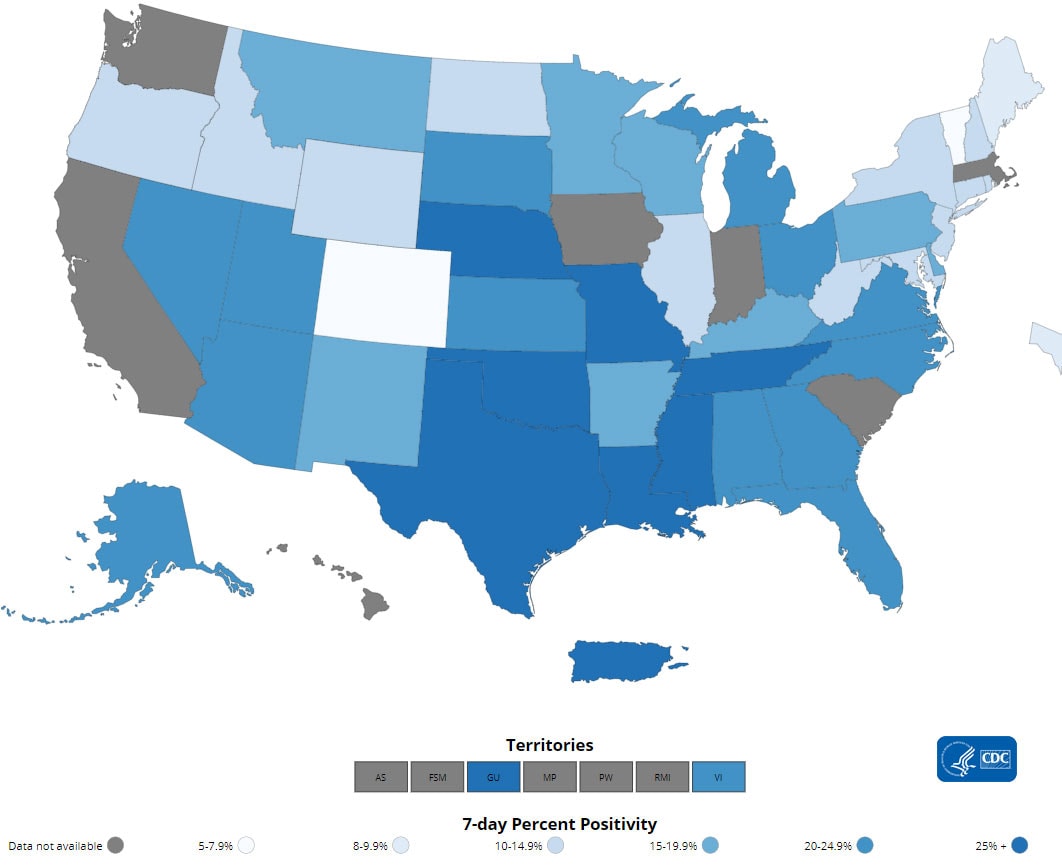
Testing
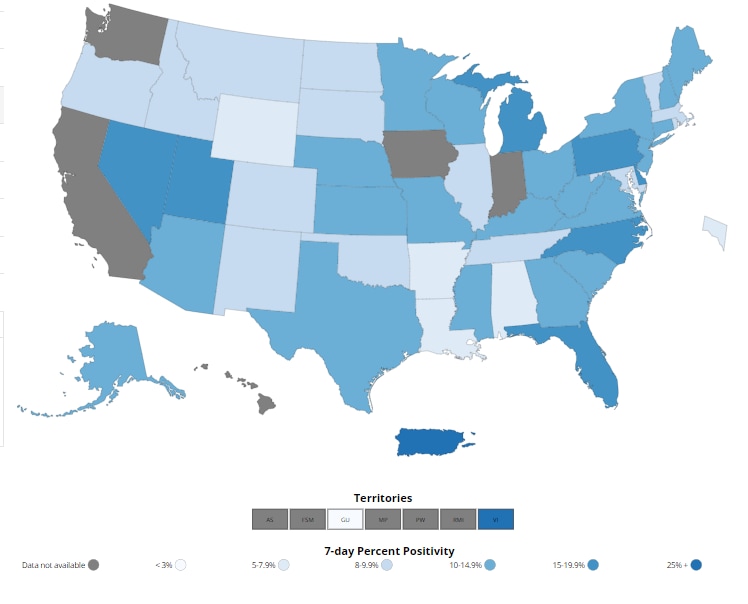
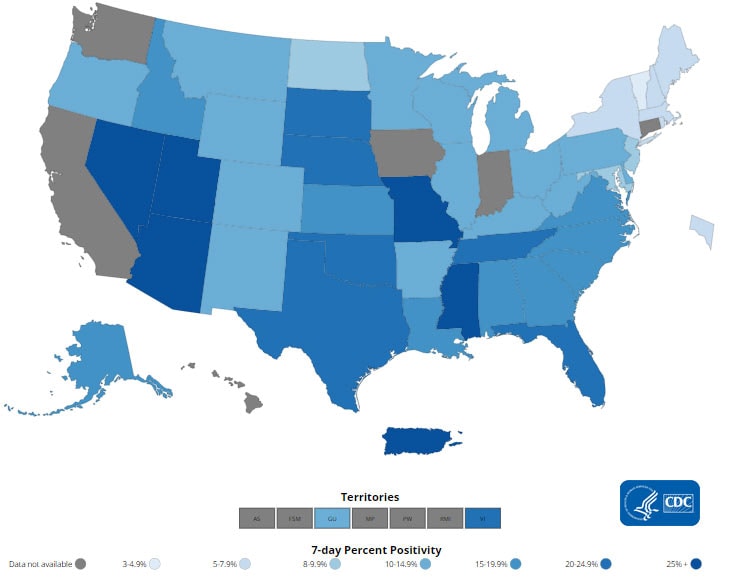
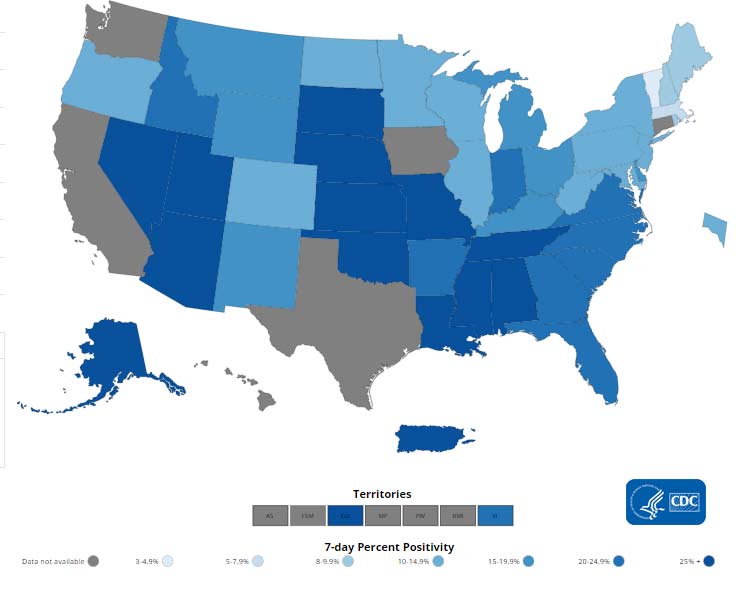
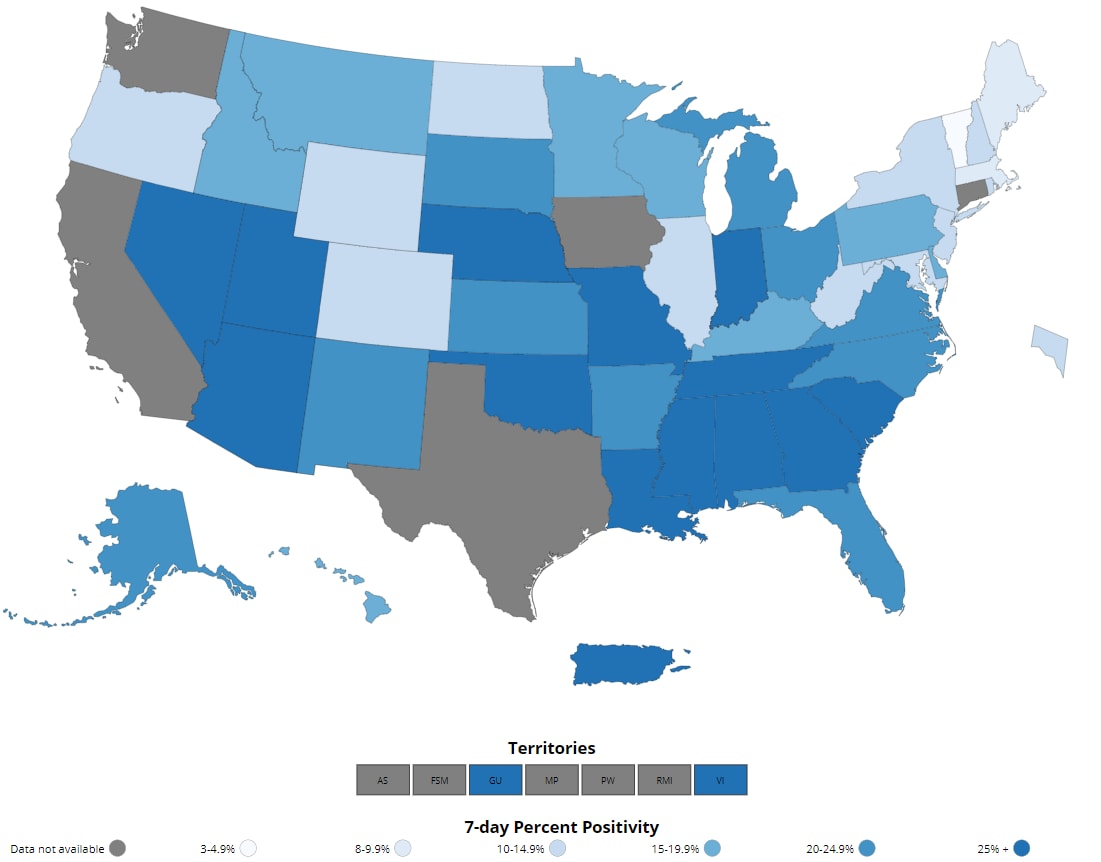
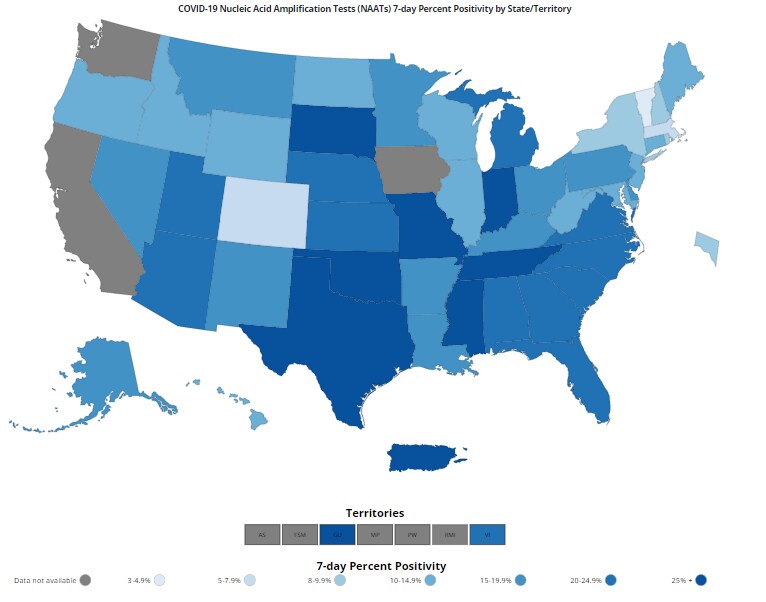
The percentage of COVID-19 NAATs (nucleic acid amplification tests)* that are positive (percent positivity) is increasing in comparison to the previous week. The 7-day average of percent positivity from NAATs is now 10.6%. The 7-day average number of tests reported for May 6-May 12, 2022, was 798,164, up 0.9% from 791,248 for the prior 7 days.
882,620,173
Total Tests Reported
798,164
7-Day Average Tests Reported
10.6%
7-Day Average % Positivity
8.6%
Previous 7-Day Average % Positivity
+2.01
Percentage point change in 7-Day Average % Positivity since Prior Week
*Test for SARS-CoV-2, the virus that causes COVID-19
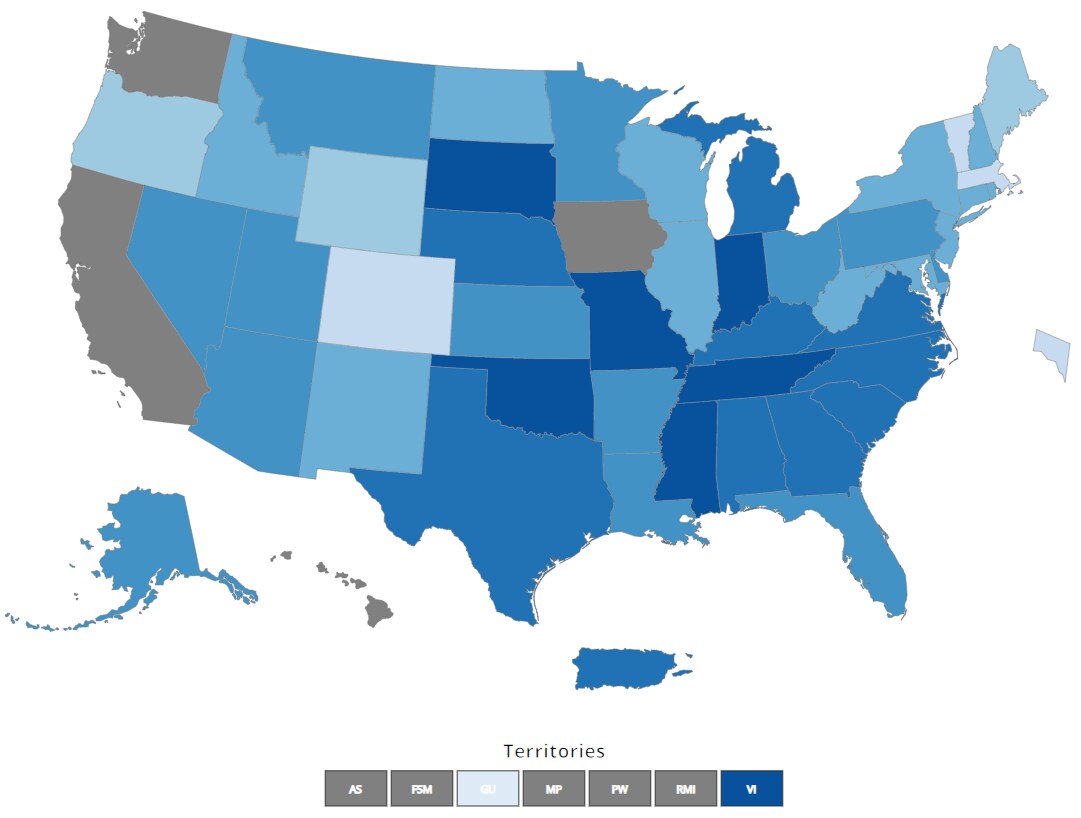
COVID-19 NAAT Laboratory Test 7-day Percent Positivity by State/Territory
resize iconView Larger
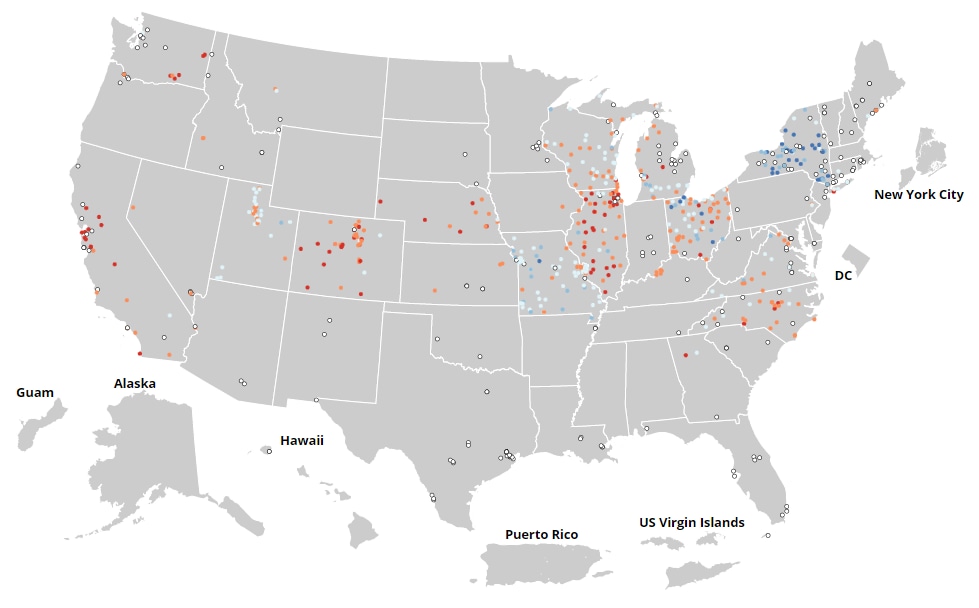
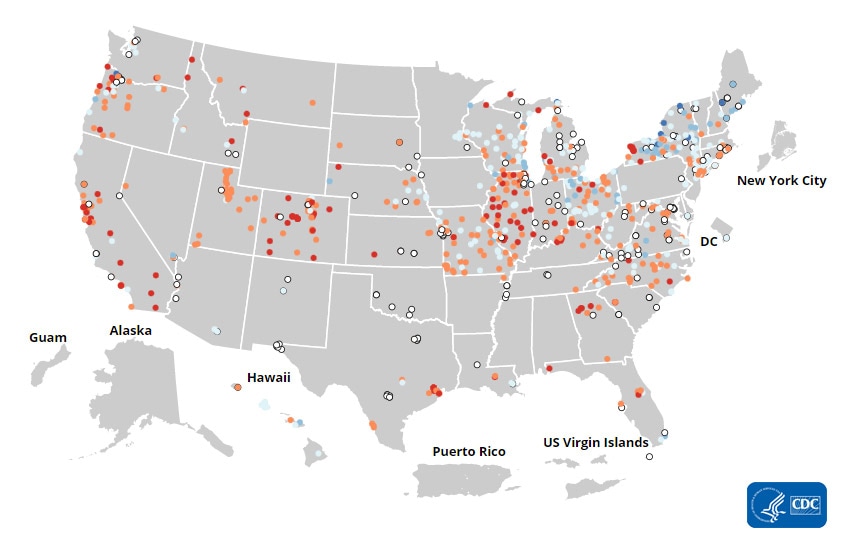
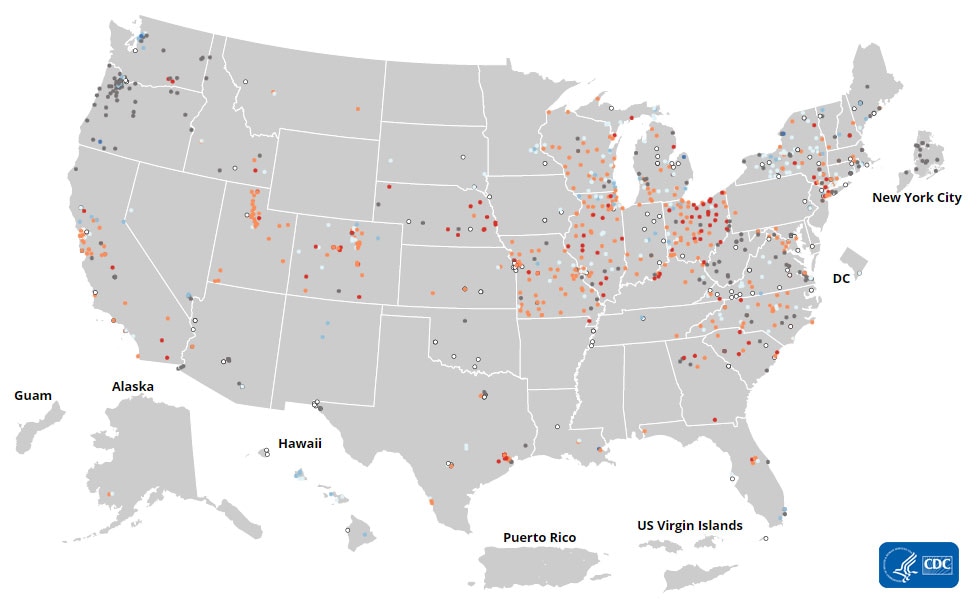
More Testing DataWastewater Surveillance
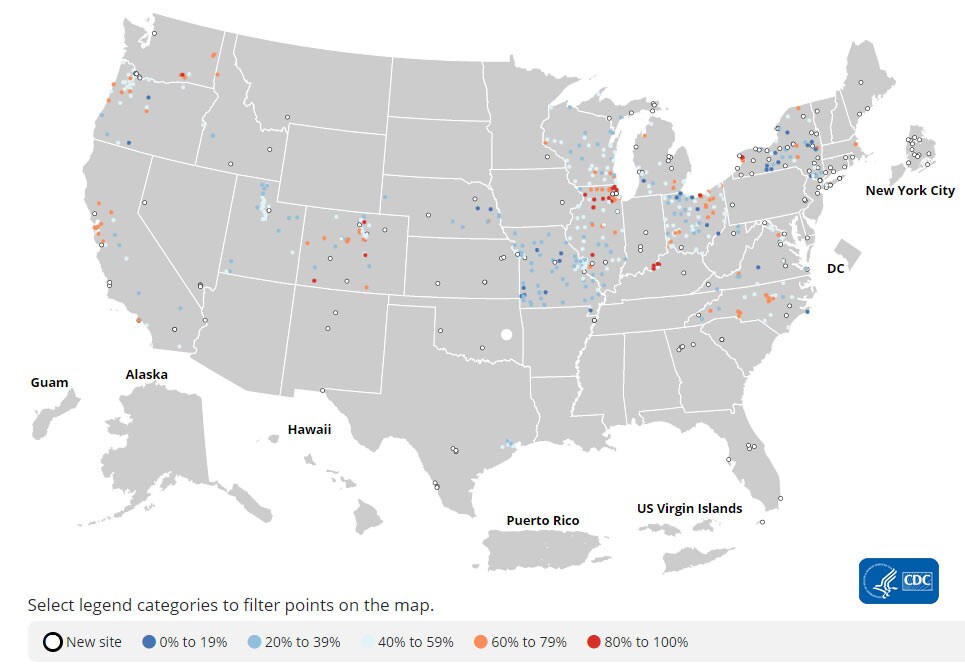
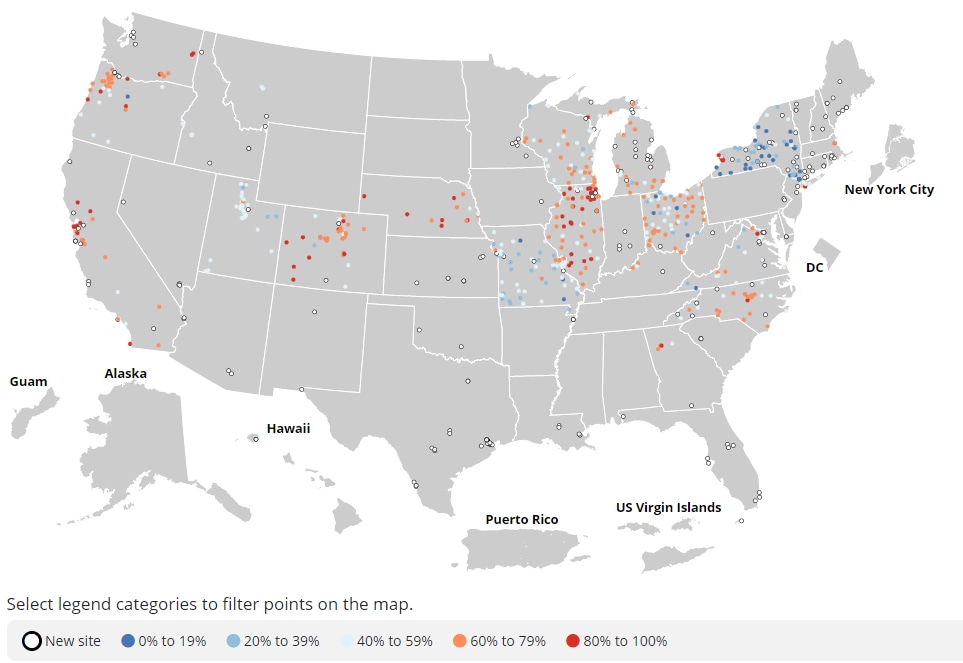
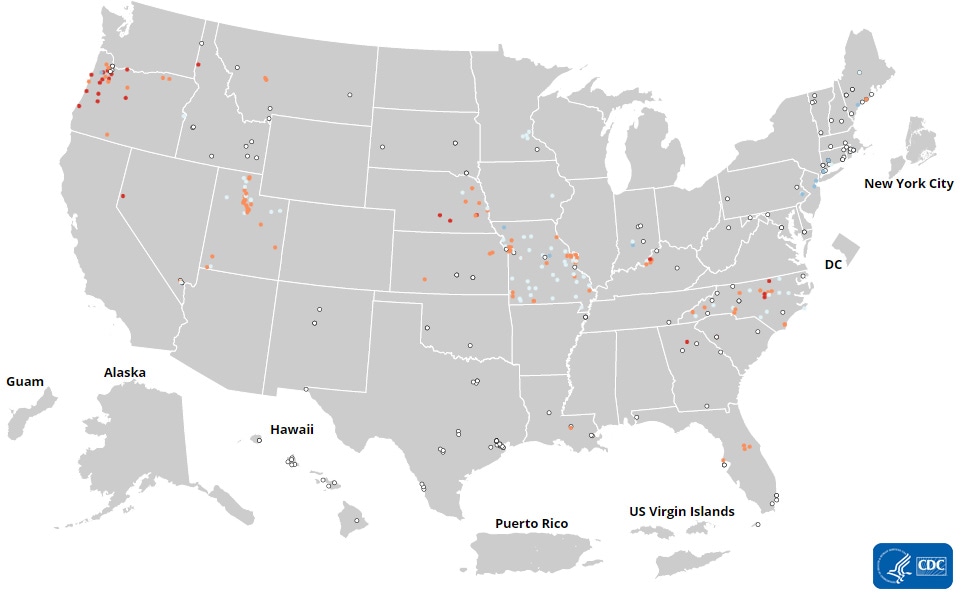
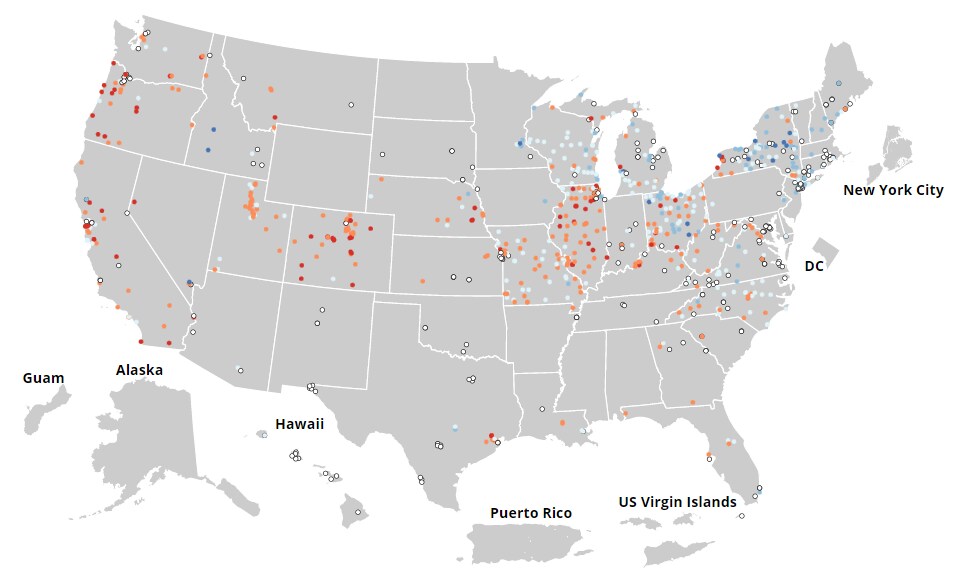
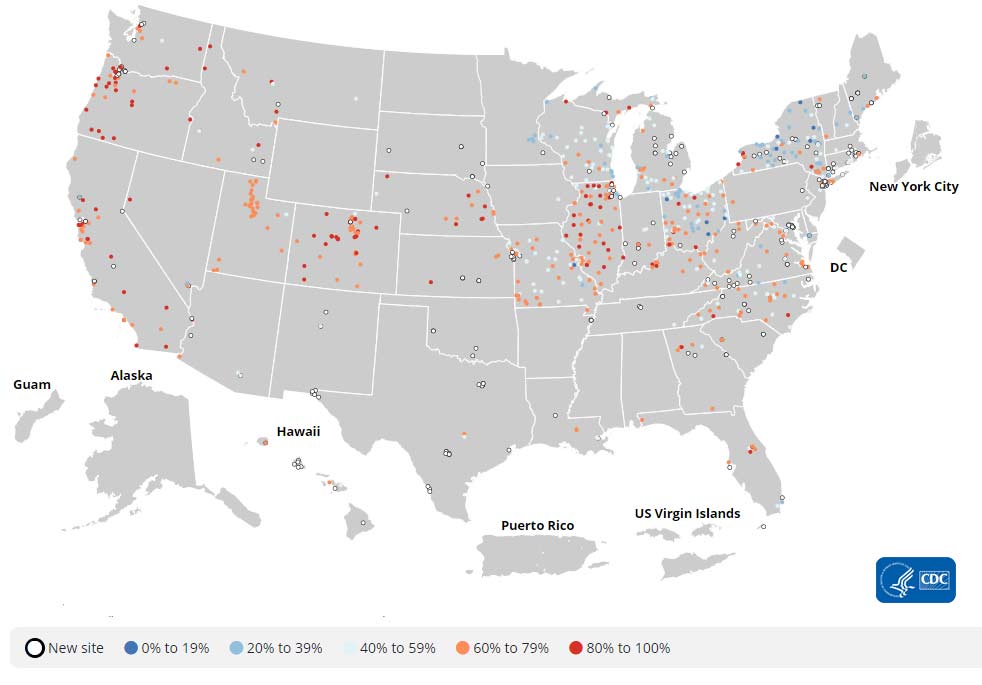
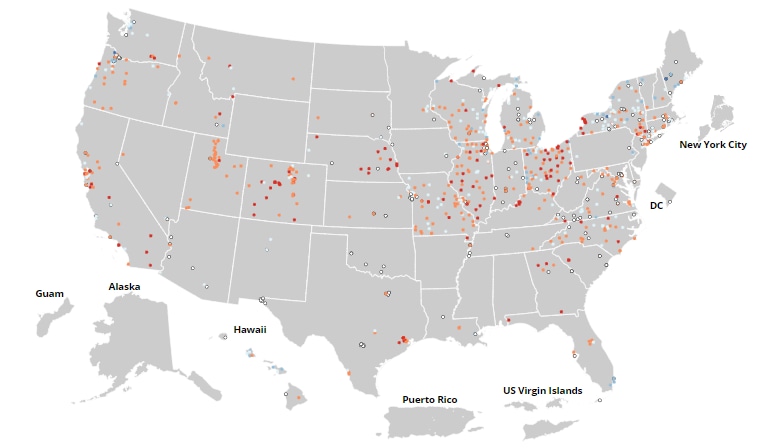
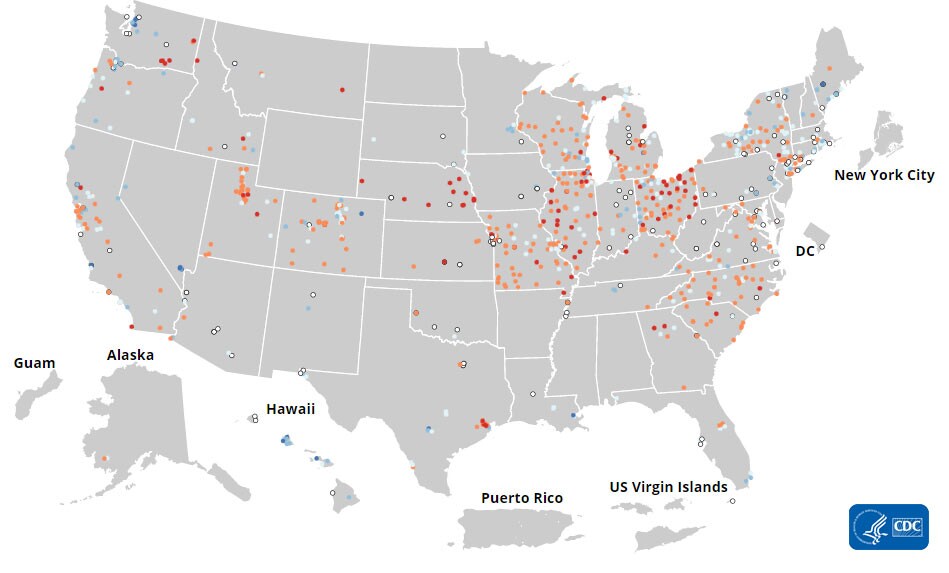
COVID Data Tracker’s Wastewater Surveillance tab tracks levels, changes, and detections of SARS-CoV-2* viral RNA in wastewater at nearly 900 testing sites across the country.
Currently, most of the country is reporting moderate SARS-CoV-2 levels in wastewater. Around 27% of sites are currently seeing some of the highest levels for those sites since December 1, 2021. More than half of all sites reporting wastewater data are experiencing a modest increase in SARS-CoV-2 levels, but about a quarter of sites are reporting a decrease in SARS-CoV-2 levels in wastewater. It’s important to note that even a small increase when levels are low can appear like a dramatic increase in the percent change. For more information on how to use wastewater data, visit CDC’s website.
*The virus that causes COVID-19
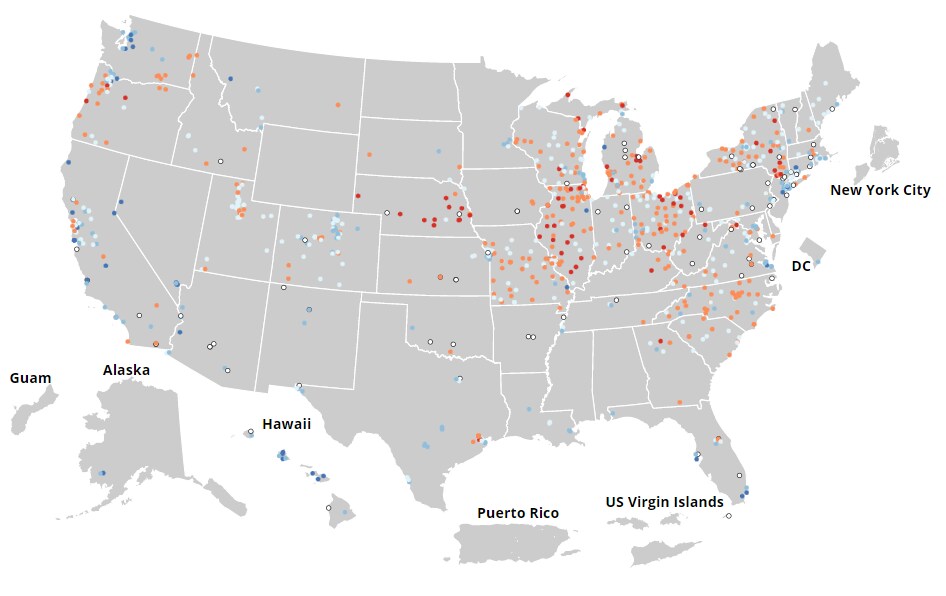
SARS-CoV-2 Levels in Wastewater by Site
resize iconView Larger
0% means levels are the lowest they have been at the site; 100% means levels are the highest they have been at the site.


 Happy Campers
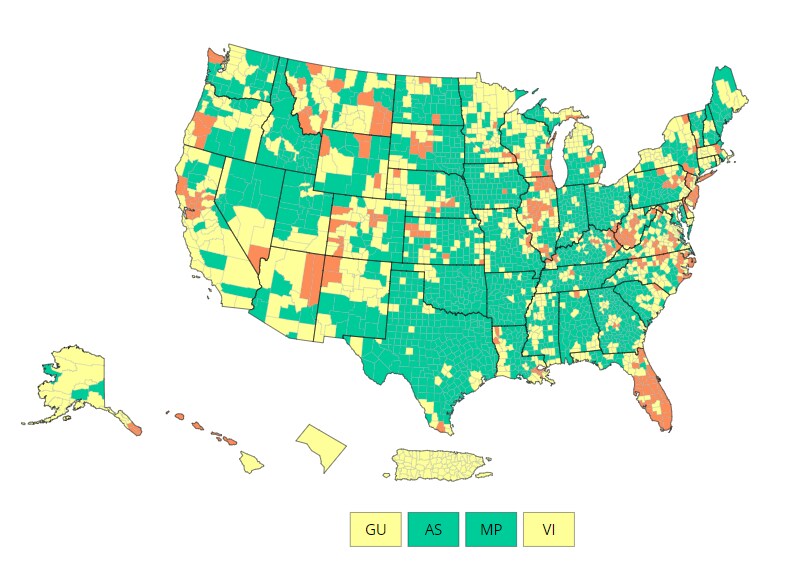


 New Kids on the Block
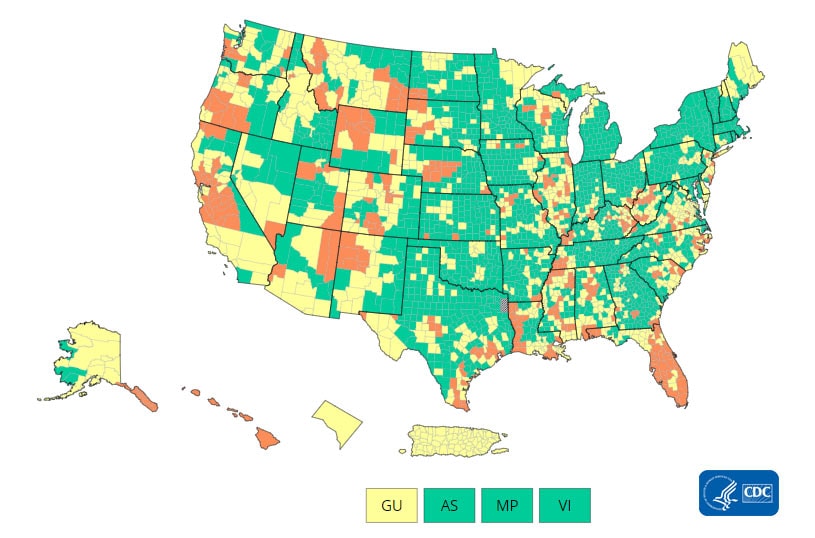


Comment