Announcement

Collapse
No announcement yet.

Discussion thread IV - COVID-19 (new coronavirus)

Collapse
X
 
  • Filter
  • Time
  • Show
Clear All
new posts

  • #16
    Flatlander et al
    I would not worry overly about the exact definitions. Some diseases are truly air-borne, like Measles, and can be transmitted over long distances. Flu and COVID are not but are carried in droplets of various sizes. The larger ones dropping to the ground almost immediately while the smallest may behave almost like air-borne. Flu produces a lot of mucus in the nose and upper respiratory tract (URT) which is explosively expelled by coughs and sneezes projecting a large droplet cloud of mixed sizes (hence the recommendation to catch as much as you can in a mask, tissue, elbow, scarf etc.). In COVID the disease is concentrated in the lower lung (LRT) but does not bind as well to the cells in the URT. This produces a dryer cough, and hopefully less of a droplet cloud. It may also create a different distribution of droplet sizes and there has been some speculation that this is resulting in more smaller droplets and so the 'safe distance' in meters of separation may need to be a bit larger. Droplets can be inhaled directly or fall on a surface and then cause infection by fomite transmission. Apart from the natural coughing transmission droplets may be generated by medical procedures that do not necessarily mimic the coughing size distribution and if a lot of small droplets are produced additional PPE and increased separation distances may be required. Regardless of the mix a radius around the infectious individual will be dangerous and the closer you are the greater the risk. For flu most droplets fall within 2m which is the general separation recommendation. If COVID is producing more of the very small nuclear droplets you may need to increase this a bit to achieve the same diminution of risk. Note 2m or 3m is not zero risk just much lower.
    Another way to think about social distancing is in terms of the reproductive number (R0). If a disease has an R0 of 2 then if you halve the number of times you put yourself at risk you reduce it to 1. Get it below one and the disease will die out. This is not difficult for most people go to the shops half as often, see half as many people at work, stay twice as far away, avoid crowds and wear gloves and a scarf. I think social distancing every flu season anyway so it is not really a change for me.
    Comment


    • Emily
      Emily commented
      Editing a comment
      I social distance during flu season, too. I will say the park and nature trails are getting very crowded near Seattle right now. With all the kids out of school and the playgrounds cordoned off and some gyms closing, they need to go somewhere in the beautiful weather.

  • #17
    Thank you to everyone on the site. You are great. The site is getting a lot of "thank you" from people.

    Comment


    • #18
      German low deathrate : https://inews.co.uk/news/health/coro...medium=twitter
      I'm interested in expert panflu damage estimates
      my current links: http://bit.ly/hFI7H ILI-charts: http://bit.ly/CcRgT

      Comment


      • #19
        Germany 87.29 million 20 deaths = 1 death per 4.36 million

        Italy 60.48 million 3,405 deaths = 1 death per .018 million

        Population data Sources include: Eurostat, INSEE 2018

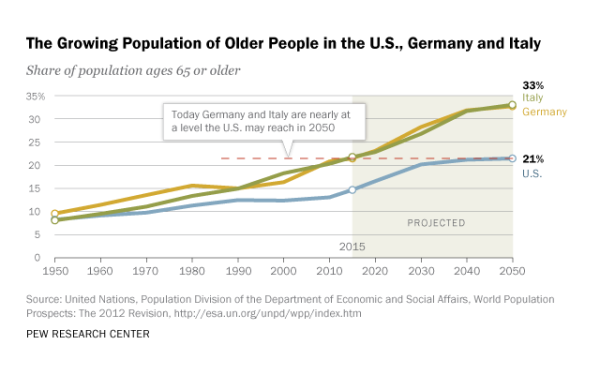
        Germany's population looks like it has a greater percentage of both 55-64 and over 64 age demographics, so the explanation is not there.


        But life satisfaction is greater in the older population of Germany. Pollution levels are higher in Italy, especially in northern Italy where the worst outbreak is:

        Aging adults in the U.S., Germany and Italy are generally happy with their lives, and many see upsides to getting older. For example, in each of the three

        The country's high death toll is due to an ageing population, overstretched health system and the way fatalities are reported
        _____________________________________________

        Ask Congress to Investigate COVID Origins and Government Response to Pandemic.

        i love myself. the quietest. simplest. most powerful. revolution ever. ---- nayyirah waheed

        "...there’s an obvious contest that’s happening between different sectors of the colonial ruling class in this country. And they would, if they could, lump us into their beef, their struggle." ---- Omali Yeshitela, African People’s Socialist Party

        (My posts are not intended as advice or professional assessments of any kind.)
        Never forget Excalibur.

        Comment


        • Frozenthunderbolt
          Frozenthunderbolt commented
          Editing a comment
          I though it might be related to the prevalence of blood types in the respective populations but their Type A and Type O numbers seem fairly comparable.

        • JimO
          JimO commented
          Editing a comment
          I read yesterday that Germany isn't testing post-mortem cases, so many of the deaths might not be attributed to COVID-19.

      • #20
        This is interesting. The professor is an American who was spending a year in Milan. She has a background that led her to flee immediately.

        https://www.wweek.com/news/state/202...n-the-schools/
        Graboyes: About three weeks ago was when local transmission was first reported here in Italy—and it was reported in three towns that were just about an hour outside of Milan, which is where we've been living since the summer. And as soon as I saw that I knew that we needed to leave. [We] packed up our stuff and left the next day. And we haven't been back to our apartment since then.
        _____________________________________________

        Ask Congress to Investigate COVID Origins and Government Response to Pandemic.

        i love myself. the quietest. simplest. most powerful. revolution ever. ---- nayyirah waheed

        "...there’s an obvious contest that’s happening between different sectors of the colonial ruling class in this country. And they would, if they could, lump us into their beef, their struggle." ---- Omali Yeshitela, African People’s Socialist Party

        (My posts are not intended as advice or professional assessments of any kind.)
        Never forget Excalibur.

        Comment


        • #21
          I remember this being brought up before about hospital beds per 1,000. This website shows comparisons: https://www.indexmundi.com/facts/ind...SH.MED.BEDS.ZS

          Comment


          • Missouriwatcher
            Missouriwatcher commented
            Editing a comment
            Does one also question China's reporting of deaths?

          • kiwibird
            kiwibird commented
            Editing a comment
            I'm moving to Greenland!

        • #22
          I certainly question Chinese numbers. Looking at the rest of the world I suspect they are a tiny fraction of reality. And I suspect we will never see an excess deaths estimate.
          Twitter: @RonanKelly13
          The views expressed are mine alone and do not represent the views of my employer or any other person or organization.

          Comment


          • #23
            CNN: Data from China shows the majority of people with Covid-19 only suffer mild symptoms, then recover...Latest data from Italy shows a similar pattern... the median average age of those who died after contracting the virus in Italy is 80.5 years old, while the median average for those infected is 63... health officials in France have found that half of all coronavirus patients currently in intensive care across the country were under the age of 60....The Italian government also found that most people who died of the virus had two or three existing health conditions before being infected with the coronavirus https://www.cnn.com/2020/03/20/healt...ntl/index.html

            Comment


            • #24
              Apple news or TMZ is reporting a 34 year old death due to contact at Disney World. That may be click bait. But the interesting detail is the child asthma and bronchitis as a possible pre-existing condition. As well there was pre-ex testicular cancer 5 years previous, so I assume there was further risk.

              The asthma/bronchitis and even common cold is a big concern in northern jurisdictions. It’s spring melt here, with mould etc coming out again. And there’s tons of salt and sand, along with bacteria, on the roads being kicked up by cars and road cleaning machines.

              There’s lots of talk about pre-X conditions of older people or immune compromised people. But is there evidence that we should could consider child diseases and susceptibility to lung infections, regardless of age, as similar risks?

              Comment


              • #25


                FluTrackers.com
                @FluTrackers

                16m

                Make Your Own Mask weekend.

                A "last resort" as per CDC & in "better than nothing" category.

                I am wearing one I made IN MY HOUSE to protect me from others until 14 days goes by. Household transmission is high.

                Take your power back from this disease.

                https://flutrackers.com/forum/forum/ideas-on-how-to-protect-yourself-from-new-coronavirus-2019-ncov/discussion-how-to-make-a-mask


                FluTrackers.com
                @FluTrackers

                18m
                A homemade mask is not going to prevent you from getting COVID-19 but it might help somewhat. Literally a "better than nothing" action.

                Comment


                • #26
                  I have followed China for 14 years and I would not believe one thing that they say unless it is supported by independent sources.

                  Comment


                  • #27
                    I am going to come to the support of China again. It has been disappointing, if not surprising, to watch the US MSM's disbelief in the Chinese numbers given that the US has been in an economic/sanctions and propaganda war with the Russia/China alliance for some time. I note each time the media wants to hold up countries which have handled their outbreak well they list S Korea and Singapore but not China. This is not a fair comparison as of the three China is in far the best position and got sucker-punched and bought time for the rest of us time to prepare, at great cost to themselves, which we squandered. Bruce Alyward's WHO team had free reign to look at the situation on the ground and at all the data and I have not heard a peep from any of them doubting the data. Korea got lucky in their first cases were is a small religious sect with a very young age distribution and excellent records of its membership which greatly reduced the case fatality rate and made contract tracing simple. Singapore is a small island, one of the richest countries in the world and probably has the world's best healthcare system. How anyone can believe that China is fudging its numbers to any significant extent defeats me. They openly reported their numbers climb to 4000/day and have now reopened most of the country to fairly normal levels of economic activity with the expected signs of increased transmission, by which I mean their daily cases have increased from 20 to 60, in a population the size of N America and Europe combined. It will be interesting to watch how they use the accelerator and breaks to keep numbers manageable. In contrast nearly all of the 18,000 new case in the graph below came from Europe and N America. If China had not controlled their outbreak they would be reporting 40,000 cases a day by now which is beyond any countries ability to hide.
                    If you want to look at countries who are fudging their number then the US, and my country the UK, would be good examples. I would argue that in both cases their governments failed to learn from China that controlling the outbreak by testing and contact tracing (per the WHO guidelines) first and worrying about the economic consequences afterwards is the way to go. An act of hubris led them to think their healthcare systems could handle things better and in the balance between their population's health, and economic health, things could be safely skewed a little more towards the economy. The consequence has been a slow ramp up of testing capacity and a laissez faire attitude towards contact tracing leading to a period of undocumented community spread and major under reporting. I expect the consequence of this mistake to become apparent in the next few weeks as both countries surpass Italy's disease burden - Italy at least moved faster and earlier.


                    Click image for larger version  Name:	sit rep.JPG Views:	21 Size:	133.4 KB ID:	839132
                    The graph is from today's WHO sit-rep. (You need to mentally redistribute the 23th Feb spike across the days around it as it is an artefact of China's ramping up of testing being out stripped by the rate of epidemic growth from about the 4th of Feb.)
                    The dangers at present are India/Pakistan/Bangladesh and Africa. The Indian sub-continent contains more people than China but very poor healthcare for its population size. The African continent is the largest outside Asia, in population terms, again with poor facilities. I can not see how either can contain this without massive outside help, which is not going to be forthcoming. Expect them to follow an Italian trajectory without any breaking mechanism. A million cases a day from the sub continent with a CFR of near 10% would not surprise me as most would be lucky to see a doctor and will get absolutely zero treatment of any kind. All the main outbreaks, to date, are occurring in wealthy countries where very few have suffered entirely without support and many have never got to the ICU stage due to oxygen support early enough to blunt disease progression. We do not know yet what the CFR is for someone in a hut with poor nutrition while in the womb and throughout life, no medicine of any kind and quite possibly no one to even bring them food and water. I fear it will be a rude awakening for us all and the only slim hope is that once over the balance of what we spend preparing to fight each other and what we spend preparing to fight disease will be be re-assessed.

                    Comment


                    • #28
                      JJackson - you can believe China all you want but the fact remains that no disease outbreak has a curve like China's COVID-19 cumulative cases curve. It goes up and up and then abruptly stops the ascent and has a straight line. This is ridiculous. All disease outbreaks have a cumulative bell curve. You know this.

                      As to all other countries....well...all of them downplay their bad news. It is a matter of degrees.

                      And the main stream media? Forget it.

                      The fact is that the global elites don't give a **** about regular people. They play us every way they can by manipulating the governments, international organizations, and the media.

                      Comment


                      • #29
                        Sharon the cumulative case curve only ever goes up and up. The daily case curve will rise peak and fall exactly as it does in the graph of Chinese cases. Both are however misleading because the normal distribution curve we saw for 1918 or 2009 are a reflection of a disease reaching a natural R(0) of one or less due to acquired herd immunity post mitigation with no serious attempt at containment. For a disease with a natural R(0) of 2 half the population needs to be immune for it to fall to one by this means. China, if you believe the real number of cases to be a million, would have 1/1,400 or 0.0007% of its population immune if antibodies give complete immunity. For COVID herd immunity would require nearer a billion infection. No country has reached a point where herd immunity is playing any significant role. If the exponential growth is blunted, or reversed, it is due to social distancing and associated containment measure. Some of the comments I am seeing imply this will peak in a few months I would say 'you ain't seen nothing yet'.

                        The graph below shows the UK 2009 pandemic curve, the point to note is the numbers on the y axis, over a 100,000 cases at the peak for 50 million population. We are currently entering a shutdown mode (better late than never) with this being the last day of school for most. There are 30 data points over 7 months i.e. if yesterday's UK new case count was real it would need to be multiplied by 25 to match the graphs scale which would be ~17,000 which would put us at about the 1st of Jul on this epidemic curve. Even the drop from the high peak is only due to flu's extreme seasonality and there is no evidence to support this for COVID, just wishful thinking and hope. Increased UV will definitely help cut fomite transmission but other seasonal factors are an unknown.

                        Click image for larger version

Name:	2009.JPG
Views:	1299
Size:	62.4 KB
ID:	839156

                        Comment


                        • #30
                          Originally posted by JJackson View Post
                          Sharon the cumulative case curve only ever goes up and up. The daily case curve will rise peak and fall exactly as it does in the graph of Chinese cases. Both are however misleading because the normal distribution curve we saw for 1918 or 2009 are a reflection of a disease reaching a natural R(0) of one or less due to acquired herd immunity post mitigation with no serious attempt at containment. For a disease with a natural R(0) of 2 half the population needs to be immune for it to fall to one by this means. China, if you believe the real number of cases to be a million, would have 1/1,400 or 0.0007% of its population immune if antibodies give complete immunity. For COVID herd immunity would require nearer a billion infection. No country has reached a point where herd immunity is playing any significant role. If the exponential growth is blunted, or reversed, it is due to social distancing and associated containment measure. Some of the comments I am seeing imply this will peak in a few months I would say 'you ain't seen nothing yet'.

                          The graph below shows the UK 2009 pandemic curve, the point to note is the numbers on the y axis, over a 100,000 cases at the peak for 50 million population. We are currently entering a shutdown mode (better late than never) with this being the last day of school for most. There are 30 data points over 7 months i.e. if yesterday's UK new case count was real it would need to be multiplied by 25 to match the graphs scale which would be ~17,000 which would put us at about the 1st of Jul on this epidemic curve. Even the drop from the high peak is only due to flu's extreme seasonality and there is no evidence to support this for COVID, just wishful thinking and hope. Increased UV will definitely help cut fomite transmission but other seasonal factors are an unknown.

                          Click image for larger version  Name:	2009.JPG Views:	17 Size:	62.4 KB ID:	839156
                          I agree with your UK graph and this is exactly what we are not seeing in China despite their claim of no new cases. Their case growth simply stopped on a dime and flattened. Magic! No new growth anymore!

                          Maybe they have some vaccine to prevent COVID-19 that they should be telling the world about.


                          Click image for larger version

Name:	chinagraph.PNG
Views:	1255
Size:	275.8 KB
ID:	839170

                          Comment

                          Working...
                          X