 Tweet
Tweet
Our COVID Pandemic: How Long Can It Last?

Credit GAO
#16,869
With the COVID crisis now well into its 30th month, and showing no signs of abating, many are wondering just how long this pandemic can last. Prior to COVID, `conventional wisdom' - based primarily on the 1918 pandemic - held that a severe influenza pandemic could come in multiple waves over as many as 18 months.
But some pandemic planners have been far more optimistic.
In 2006's Putting Lipstick on a Pig, we looked at one estimate that suggested a 3 to 6 month avian flu pandemic was plausible. Also that year, we looked at South Carolina's pandemic plan (see Guess That’s Why It’s Called The Low Country) that offered the following optimistic scenario.
An influenza pandemic affects between 30% and 50% of the population. If 30% of South Carolina’s population were stricken by a pandemic, 1,200,000 would seek medical assistance and up to 17,000 would need hospital care. There could be from 2,000 to 5,000 deaths, and the effects of a pandemic would last six weeks or more in a community.
According to the latest data, South Carolina's COVID death toll has now passed 18,000.
In fairness, most of the federally mandated pandemic plans that year assumed a `mild or moderate' pandemic, often anticipating a fraction of the impact of what the CDC/HHS was expecting. In 2007's Wishing on a Czar, we looked again at this huge disparity between jurisdictions.
In 2009, just as the relatively mild H1N1 pandemic was ramping up, we looked at the potential duration of a pandemic (see The Pandemic Influenza Enigma), by examining influenza records from the 1920s and beyond.
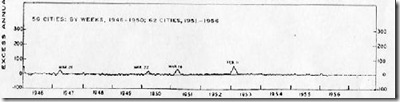
Most historians will tell you the 1918 pandemic went from March of 1918 to June of 1920, but the following graph shows that influenza continued to produce severe spikes of illness across the United States for most of the decade that followed.
This data from 1957's REVIEW AND STUDY OF ILLNESS AND MEDICAL CARE WITH SPECIAL REFERENCE TO LONG-TIME TRENDS Public Health Monograph No. 48, 1957 (Public Health Service Publication No. 544)
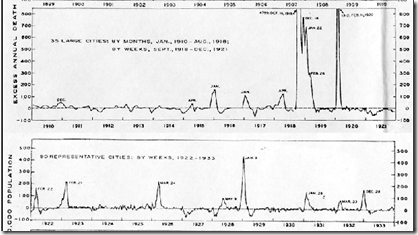
(Note: the scale of these two graphs are different)
The two main spikes of 1918 and 1919 are readily apparent, but as you can see, there were significant increases in P&I mortality rates in 1922, 1923, 1926, and 1929. Nothing to compare with the 1918-1919 outbreaks of course, but significant if you were caught up in one.
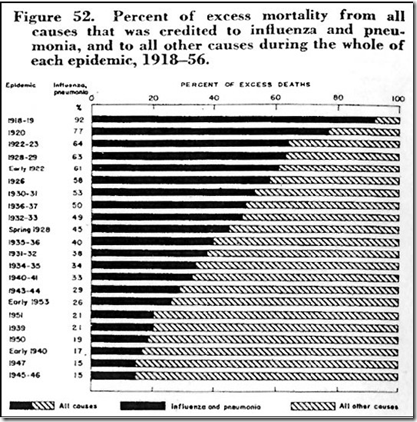
Again, the above graphic shows that the top 6 time spans between 1918 and 1956 for percentage of excess P&I mortality were all in the decade following the 1918 pandemic.
Given that the zeitgeist of the 1920s was to put the carnage of the Great War and the Spanish flu behind them, it is quite plausible that - like today - a lot of infections and deaths went unrecorded, so these may not fully represent the impacts during that time span.
Still, it is quite evident that the 1918 Spanish flu wasn't `over' by the summer of 2020.
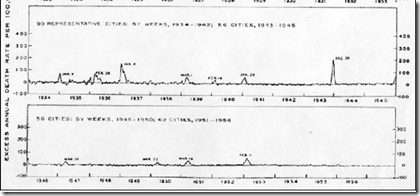
By contrast, the 1930’s and 1940’s were especially quiescent when it came to Pneumonia and Influenza mortality, even during the 2nd world war.
The next `official' pandemic - the `Asian Flu’ of 1957 - is generally thought of as coming in 2 waves, spanning from about October of 1957 to April of 1958. But a look at the pandemic waves associated with the Asian flu shows that significant spikes in P&I (Pneumonia and Influenza) mortality continued until 1963.
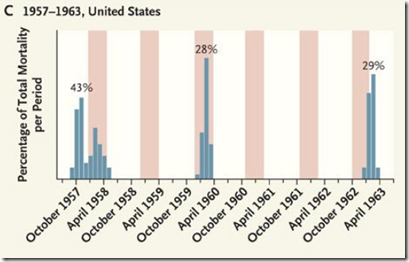
NEJM 2009
For reasons that are far from clear, the H2N2 virus `skipped’ several flu seasons, only to reappear with vigor in 1963, yet we continue to think of pandemics as being relatively short term events.
All of these examples have stemmed from influenza viruses, with major strain changes coming infrequently (1918, 1957, 1968, 2009, etc.).
Coronaviruses typicallyleave behind less permanent immunity than influenza, as explained in Fenner and White's Medical Virology (Fifth Edition - 2017),:
The typical coronavirus “common cold” is mild and the virus remains localized to the epithelium of the upper respiratory tract and elicits a poor immune response, hence the high rate of reinfection. There is no cross-immunity between human coronavirus-229E and human coronavirus-OC43, and it is likely that new strains are continually arising by mutation selection.
Add in COVID-19's rapid and continual evolution (Wuhan, D614G, Alpha, Delta, Omicron . . . .), and `herd immunity' - even with the aid of a vaccine - becomes difficult to achieve.
Just as we've seen with seasonal influenza, COVID waves are likely to continue for the foreseeable future. Some waves may be mild, while others perhaps not so much.
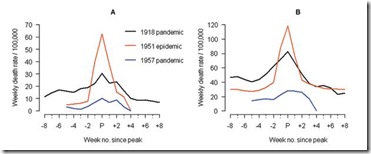
While we discussed it a length in Remembering 1951: The Year Seasonal Flu Went Rogue, there is historical precedent for seeing an unusually deadly wave of influenza emerge, even during an otherwse mild non-pandemic year.
The winter of 1950-1951 had been an average flu year, with the dominant flu called the `Scandinavian strain', which produced mild illness in most of its victims. In fact, if you look at a graph of flu activity for the United States, running from 1945 to 1956, you'll see nary a blip.
But in December of 1950 a new strain of virulent influenza appeared in Liverpool, England, and by late spring, it had spread across much of England, Wales, and parts of Canada.
The following comes from an absolutely fascinating EID Journal article: Viboud C, Tam T, Fleming D, Miller MA, Simonsen L.
The 1951 influenza epidemic (A/H1N1) caused an unusually high death toll in England; in particular, weekly deaths in Liverpool even surpassed those of the 1918 pandemic. . . . . Why this epidemic was so severe in some areas but not others remains unknown and highlights major gaps in our understanding of interpandemic influenza.
According to this study, the effects on the city of origin, Liverpool, were horrendous.
In Liverpool, where the epidemic was said to originate, it was "the cause of the highest weekly death toll, apart from aerial bombardment, in the city's vital statistics records, since the great cholera epidemic of 1849" (5). This weekly death toll even surpassed that of the 1918 influenza pandemic (Figure 1)
Getting started relatively late in the flu season, this new strain never managed to spread much beyond UK and Eastern Canada. Nor did it reappear the following flu season. It simply vanished as mysteriously as it appeared.
But it should remind us that viruses are unpredictable, and we can't afford to always assume the `best-case scenario'.
Hopefully, over time, COVID will slow its mutation rate, which should help updated vaccines and acquired immunity to reduce its impact. But unless and until that happens, COVID is unlikely to go gently into the night.
Until then, I would take any `estimates' of when this pandemic will be over with a very large grain of salt.
